August 3, 2016
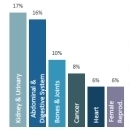
Excel Chart Colors
I was reading a health magazine last week and the chart below caught my eye. click image to enlarge (sorry
Read More
August 3, 2016
I was reading a health magazine last week and the chart below caught my eye. click image to enlarge (sorry
Read More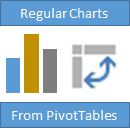
July 5, 2016
PivotTables are a great way to summarise your data, but PivotCharts can be a pain in the, um, neck. PivotChart
Read More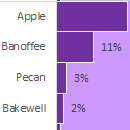
May 18, 2016
For many people when they think of a chart that shows parts to a whole, a pie chart is the
Read More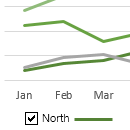
May 10, 2016
Using interactive Excel charts in your dashboards and reports allows the user to pick and choose what they want to
Read More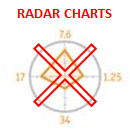
February 23, 2016
I get the fanfare around infographics. They’re used to make information more appealing, grab attention, awaken interest, lessen boredom and
Read More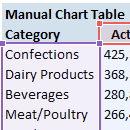
December 8, 2015
In an ideal world our data will be in one table so we can easily analyse it in a PivotTable
Read More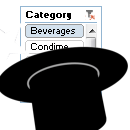
October 13, 2015
That’s a rubbish title, I know. I couldn’t think of a succinct way to describe what I’m about to show
Read More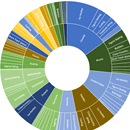
September 15, 2015
With Office 2016 officially launching on September 22, 2015 I thought I’d give you a sneak peek at a few
Read More
July 23, 2015
Put some spark in your chart! Excel Sparklines were introduced in Excel 2010 and are great for displaying the trend
Read More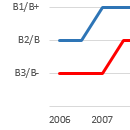
April 14, 2015
In this tutorial we’re going to look at how we can twist Excel’s arm into putting text labels on the
Read More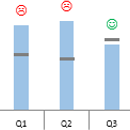
April 1, 2015
In my previous life as an accountant one of my main tasks was to analyse budget vs actual variances and
Read More
March 24, 2015
A new feature in Excel 2013 is called Quick Analysis – it’s data analysis made easy, so easy my 6
Read More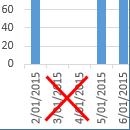
January 28, 2015
In this tutorial we're going to look at how we can skip dates in the Excel chart axis for those
Read More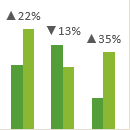
January 5, 2015
Using Excel custom chart labels is a great way to create a more insightful chart without having to show a
Read More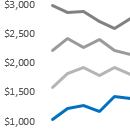
October 13, 2014
Getting the formatting in your chart right can make the difference between clear, concise information and just a pretty picture.
Read More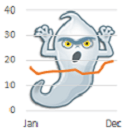
July 22, 2014
Below is a set of Panel Charts. In this case they’re actually 4 separate charts aligned close together. Comparing one
Read More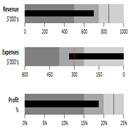
July 15, 2014
Bullet graphs were developed by data visualisation expert Stephen Few to address the need for visually rich displays of data
Read More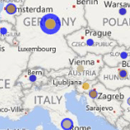
June 16, 2014
If you don’t have Excel 2013 then this post will be a bit like window shopping with an empty wallet.
Read More
May 6, 2014
Charts are great at revealing trends, patterns and relationships in your data. We love how they enable us to glean
Read More
April 22, 2014
If you find yourself repeatedly spending a few minutes customising your chart colours, formatting the title, legend, axis labels etc.
Read More
March 12, 2014
Last week I wrote about how I used Excel to design a Minecraft cake. The response to that post was
Read More
January 23, 2014
Last week we looked at some different ways to plot the same data, with each chart enabling the reader to
Read More
January 15, 2014
Often when you’re charting data it can be tricky to find the best chart for the job. If you get
Read More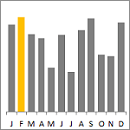
October 16, 2013
I see the same innocent mistakes with Excel charts and data presentation over and over again. And a lot of
Read More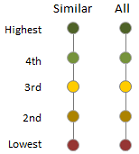
August 7, 2013
One of my Excel Dashboard course members, Mark Maher, emailed me wanting to know if a chart that Stephen Few
Read More
July 2, 2013
Today I’d like to share with you a video tutorial by Isaac Gottlieb on supply-chain decision making from his book
Read More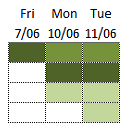
May 28, 2013
Gantt charts are handy for planning and managing project tasks over time. They give a visual representation of the whole
Read More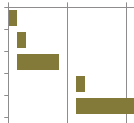
May 22, 2013
Gantt charts are commonly used in project management and while Excel doesn’t have a native Gantt chart in its chart
Read More
April 25, 2013
I recently came back from a family skiing vacation in Whistler, Canada, which by the way was fantastic. Here we
Read More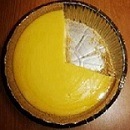
March 13, 2013
As fun as this chart is, it actually makes a valid point and that is; pie charts are (typically) not
Read More