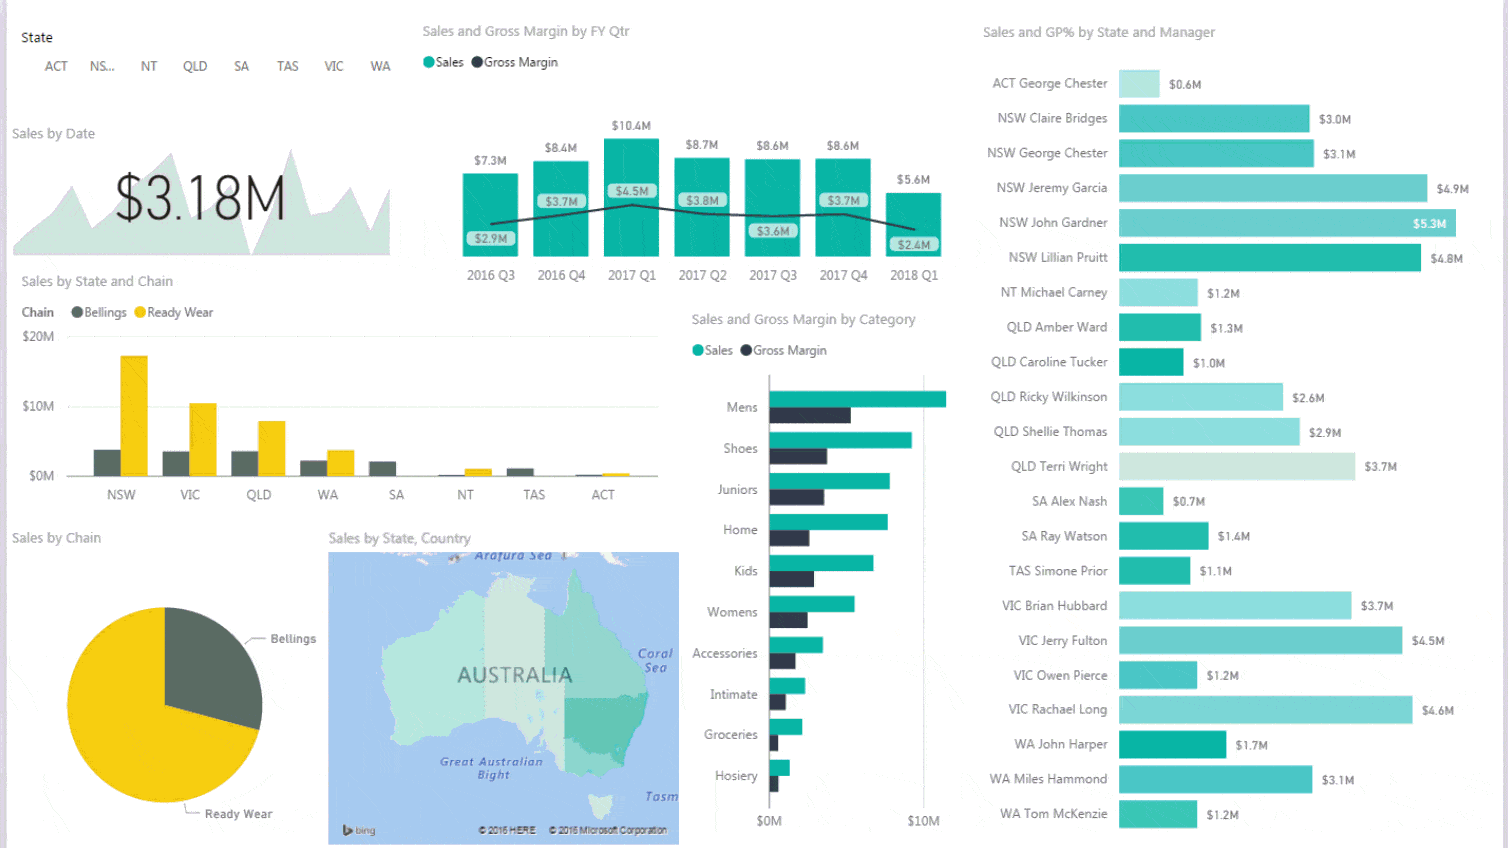
Take Your Dashboards To The Next Level With Interactive Power BI Visualizations Like This
What is Power BI?
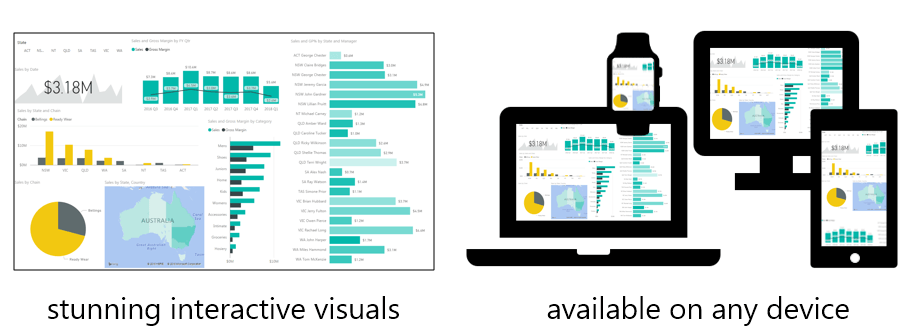
Power BI is Microsoft’s business intelligence (BI) and data visualization tool that enables you to quickly develop stunning interactive dashboards that bring your data to life and enable you to monitor your business on every device.
Once set up, your reports can be scheduled to update themselves and automatically shared securely with your audience freeing you up to work on other projects.
The free Power BI Desktop tool can get and model data from almost anywhere (click here to see the list) using the same Power Query and Power Pivot tools many Excel users will be familiar with. Then quickly create impressive interactive reports using the sophisticated charting and visualization gallery.
You can even embed Excel charts, tables, PivotTables and dashboards in your Power BI dashboards using the Power BI Publisher for Excel.
Securely share your dashboards and reports with people inside and outside of your organisation with the online Power BI service*, or publish them to the web like the one below:
Go ahead and try it out - click on an element in the Power BI report below and watch it respond (maximise to full screen):
*Sharing of Dashboards and Reports using the Power BI Service requires a Power BI Pro account, which is currently US$10/mth.
Who is Power BI For?
Power BI is for you if:
- You want to ramp up your skills so you're ready to take on that analyst role, or tame some big data
- You currently use Excel to build Dashboards and are ready to take them to the next level
- You have been looking for an affordable BI or reporting tool that will bring your data to life and make it readily available to your audience
Not sure if Power BI is right for you?
Here’s what Joe had to say about Power BI:
"I've wanted to get into Power BI, but wasn't convinced that it is the right tool for the job in hand, perhaps due to not seeing enough of what it can actually do, and mainly having lack of time for learning about it. Mynda has brought it all together and showed me that yes, this is the tool for the job. After seeing its practicality and real life application whilst following real life examples my jaw almost fell with amazement and excitement at the same time. Joe"
Don’t Just Take Our Word for It – Hear from People Like You:


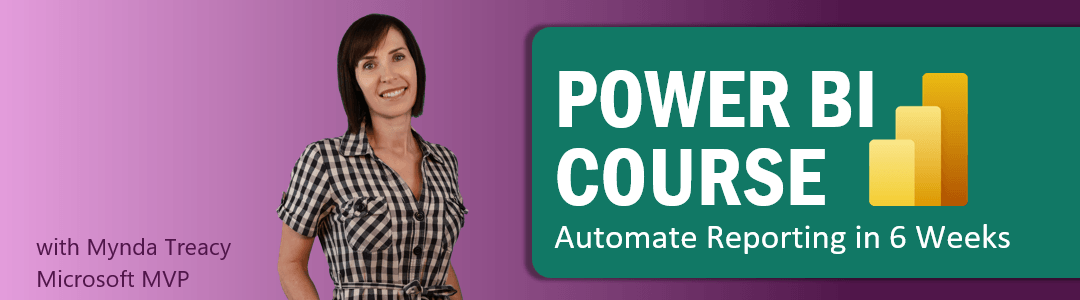
Power BI Course for Excel Users with Mynda Treacy
Now that you’ve seen how amazing Power BI is you’ll want to get up to speed quickly.
Previously BI tools like this have been cost prohibitive for most users, but Microsoft have brought BI to the masses with this amazing affordable tool.
I have been working with Excel since 1995 in both corporates and small businesses, and teaching since 2010 (not including teaching many colleagues over the years). Since Power BI was released in July 2015, I've been learning everything I can about this amazing tool and I'm excited to be able to share that with you.

Why take my course?
Power BI is a vast program with lots of functionality which is what makes it an awesome tool, but it also means there is a lot to learn and some people can find this daunting and not know where to start.
I eliminate the overwhelm so you can follow a logical path to learn all you need to know to build amazing interactive dashboards that will have your colleagues mouths gaping!
Power BI is easy to use for the most part but there are some fundamental things you must get right from the outset or you’ll run into problems.
Having Power BI, Power Query and Power Pivot skills is going to set you way above the Excel crowd and into the Data Analyst sphere with the potential to earn a higher salary.
Power BI Dashboards will enable your users to interact and drill down on the data. They can even create their own reports and views (with your permission), which will increase interest in the data and reduce your workload.
Being an Excel user myself I’ve created this course from the point of view of an Excel user, so don’t feel that you need to be familiar with databases or existing BI tools to learn and use Power BI.
Watch a Sample Tutorial - 1.03 Build this dashboard in minutes
Click on the video below to start watching. Click on the white rectangle on the bottom right of the video control bar to watch the video in full screen.
What you get in the Power BI Course
Power BI Course Syllabus - Duration 5h 19m 31s
1: Quick Start Power BI Service (0:30:32)
| 1.01 | Get Power BI Tools | 0:03:10 |
| 1.02 | Introduction to Tools and Terminology | 0:03:15 |
| 1.03 | Dashboard in Minutes | 0:13:16 |
| 1.04 | Refreshing Power BI Service Data | 0:01:56 |
| 1.05 | Interacting with Reports | 0:05:26 |
| 1.06 | Sharing Dashboards and Reports | 0:03:29 |
2: Getting and Transforming Data with Power BI Desktop (0:16:17)
| 2.01 | Introduction to Power BI Desktop | 0:09:01 |
| 2.02 | Naming for Q&A | 0:03:15 |
| 2.03 | DirectQuery vs Import Data | 0:02:34 |
| 2.04 | Key Takeaways and What's Next | 0:01:27 |
3: Modeling with Power BI Desktop (0:42:48)
| 3.01 | Introduction to Modeling | 0:01:58 |
| 3.02 | Setup and Manage Relationships | 0:06:45 |
| 3.03 | Cardinality and Cross Filtering | 0:10:15 |
| 3.04 | Default Summarization & Sort by | 0:05:50 |
| 3.05 | Creating Calculated Columns | 0:02:41 |
| 3.06 | Creating Measures & Quick Measures | 0:11:56 |
| 3.07 | Organizing Measures | 0:02:13 |
| 3.z | Recap and What's Next | 0:01:20 |
4: Building Reports in Power BI Desktop (2:23:27)
| 4.01 | Reports That Get You Noticed and Promoted | 0:01:33 |
| 4.02 | Inserting and Formatting Visuals | 0:09:07 |
| 4.03 | Tables & Matrix Tables | 0:09:33 |
| 4.04 | Hierarchies | 0:02:09 |
| 4.05 | Slicers | 0:11:13 |
| 4.06 | Cards | 0:09:55 |
| 4.07 | Conditional Formatting | 0:11:49 |
| 4.08 | KPIs | 0:03:46 |
| 4.09 | Zoom Sliders | 0:02:55 |
| 4.10 | Managing Cross Filter & Highlighting | 0:02:08 |
| 4.11 | Visual, Page and Report Level Filters | 0:08:23 |
| 4.12 | Drill Down/Up | 0:04:58 |
| 4.13 | Reference Lines, Forecasts and Anomalies | 0:05:21 |
| 4.14 | Scatter & Bubble Charts & Play Axis | 0:03:40 |
| 4.15 | Grouping & Binning | 0:04:29 |
| 4.16 | Small Multiples | 0:03:00 |
| 4.17 | Sparklines | 0:01:29 |
| 4.18 | Tooltips & Custom Tooltips | 0:04:21 |
| 4.19 | Map Charts | 0:02:28 |
| 4.20 | Drillthrough | 0:05:13 |
| 4.21 | Managing & Arranging Visuals | 0:02:51 |
| 4.22 | Themes & Custom Backgrounds | 0:04:57 |
| 4.23 | Navigation Panel | 0:01:51 |
| 4.24 | Buttons | 0:03:34 |
| 4.25 | Bookmarks | 0:07:01 |
| 4.26 | Key Influencers | 0:03:50 |
| 4.27 | Smart Narratives | 0:03:50 |
| 4.28 | Insights | 0:02:53 |
| 4.29 | Decomposition Tree | 0:04:52 |
5: Power BI Service Visualisation Tools (0:19:40)
| 5.01 | Introduction to the Power BI Service | 0:04:13 |
| 5.02 | Standalone Tiles | 0:04:18 |
| 5.03 | Data Driven Alerts (Power BI Pro/Premium) | 0:04:07 |
| 5.04 | Quick and Related Insights | 0:02:47 |
| 5.05 | Custom Q&A (Power BI Pro/Premium) | 0:04:15 |
6: Publishing and Sharing (0:40:21)
| 6.01 | Sharing Options and Publishing from Power BI Desktop | 0:04:41 |
| 6.02 | Row Level Security (Power BI Pro/Premium) | 0:06:13 |
| 6.03 | Publish to Web | 0:05:39 |
| 6.04 | Sharing Reports & Dashboards (Power BI Pro/Premium) | 0:03:37 |
| 6.05 | Creating Workspaces (Power BI Pro/Premium) | 0:02:29 |
| 6.06 | Apps (Power BI Pro/Premium) | 0:05:12 |
| 6.07 | Printing and PDFs | 0:01:43 |
| 6.08 | Embed in PowerPoint | 0:03:34 |
| 6.09 | Embed in Teams (Power BI Pro/Premium) | 0:01:55 |
| 6.10 | Embed in SharePoint Online (Power BI Pro/Premium) | 0:02:23 |
| 6.11 | Publishing for Mobile Apps (Power BI Pro/Premium) | 0:02:55 |
7: Refreshing Datasets (0:13:07)
| 7.01 | Understanding Data Refresh | 0:02:58 |
| 7.02 | Personal Gateway (Power BI Pro) | 0:06:43 |
| 7.03 | Replacing a Dataset | 0:01:39 |
| 7.04 | Lineage View (Power BI Pro) | 0:01:47 |
8: Power BI and Excel Together (0:10:57)
| 8.01 | Options for Publishing from Excel | 0:01:46 |
| 8.02 | Import Excel Power Query & Power Pivot Models | 0:03:29 |
| 8.03 | Work with Power BI Data in Excel (Power BI Pro or Premium) | 0:05:42 |
Prerequisites for the course
- No prior Power BI or BI experience required
- Power BI Desktop requires use of Power Query and Power Pivot, which are built into Power BI. If you don't already have these skills from working with them in Excel, be sure to choose a discounted bundle from the options below that includes these courses.
- Windows 10 onward so you can install the Power BI Desktop application
- Not suitable for Mac users, as the Power BI Desktop tool is only available for the PC
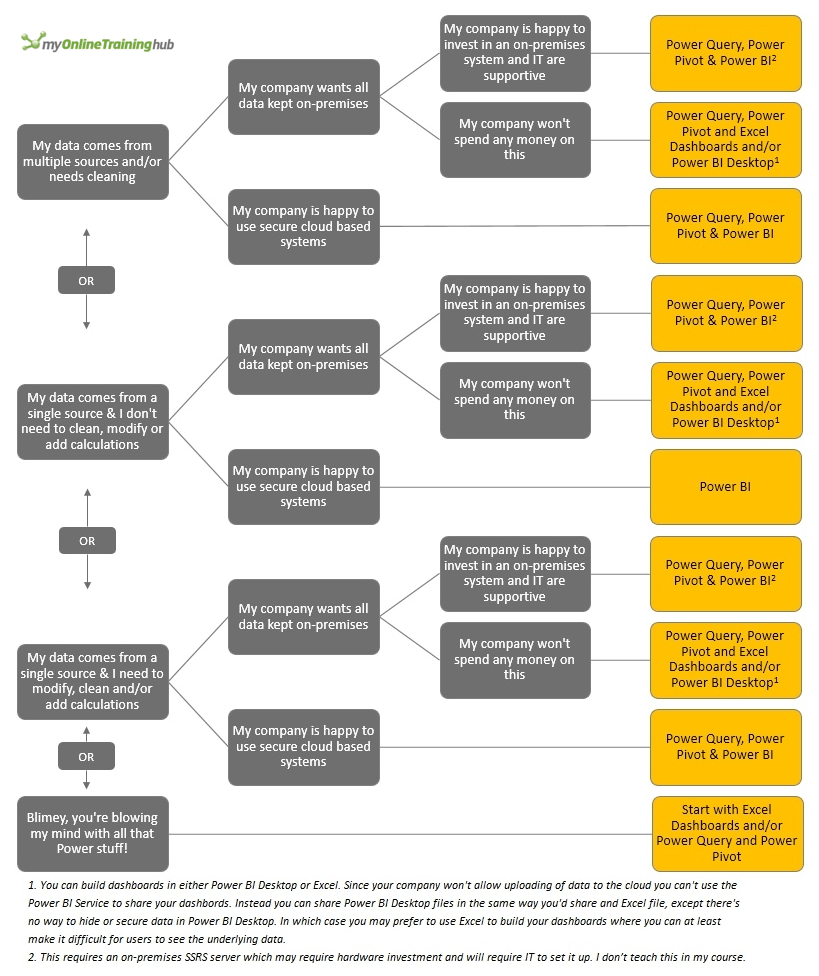
Power BI Decision Tree
I’ve built a decision tree to help you decide which components you’ll need to use. This will help you identify which courses you’ll want to sign up for (in the yellow boxes).
Not ready for all that Power?
Perhaps you’re relatively new to Excel, or you haven’t mastered the fundamentals like PivotTables and formulas yet.
If so, I have an Excel Dashboard course here where I bring your Excel skills up to speed and teach you how to build interactive Dashboards using regular Excel.
The techniques you learn in my Excel Dashboard course are also often used in your everyday Excel work, so it’s time well spent.
You can also learn Power Query and Power Pivot & DAX as these tools are used in Excel and Power BI. That way when you’re ready for Power BI you’ll be off to a head start.
Power BI FAQ’s
Q1: Does Power BI mean I don’t need to build dashboards in Excel anymore?
Not necessarily. Microsoft’s motto is ‘Power BI and Excel are better together’. They even built the Power BI Publisher add-in so you can easily add your Excel charts, tables, PivotTables etc. to Power BI.
Power BI charts aren’t yet as flexible as Excel’s, so you may prefer to build some charts in Excel and then add them to your Power BI reports using the Power BI Publisher add-in for Excel.
Also, Power BI requires knowledge of Power Query and Power Pivot & DAX and many people simply don’t have the time, or aren’t ready to learn these skills. Whereas you may already have most of the skills required to build Excel dashboards and you just need someone to show you how to put them together. This also means the learning curve is shorter and you’ll be up and running fast.
Q2: Excel vs Power BI Comparison Table
![]()
Q3: Does Power BI replace Power View?
Yes. Power BI is the replacement for Power View.
Q4: Do I have to know Power Query and Power Pivot & DAX to use Power BI?
While you can build dashboards direct in the Power BI Service, which doesn’t have Power Query or Power Pivot & DAX, this is going to be the exception and will require your data to already be in a model e.g. SQL database.
You can’t clean/edit data from within the Power BI service, nor can you add any calculations. You can only create charts and visualizations from the data as it is. Most people get data from multiple sources and need to clean it, add calculations etc. before they can start analysing it and creating charts and visualizations. This is done in Power BI Desktop using Power Query and Power Pivot & DAX.
Q5: How does Power BI compare to Tableau, Qlik or other BI tools?
Power BI is taking the BI world by storm, displacing incumbents like Tableau and Qlick with its low cost to deploy and maintain. There’s a free option and their Pro license is a meager $10/month, and because it’s cloud based it doesn’t require any expensive servers to run it.
Gartner positioned Microsoft’s Power BI in the Leaders quadrant for Business Intelligence and Analytics Platforms*:
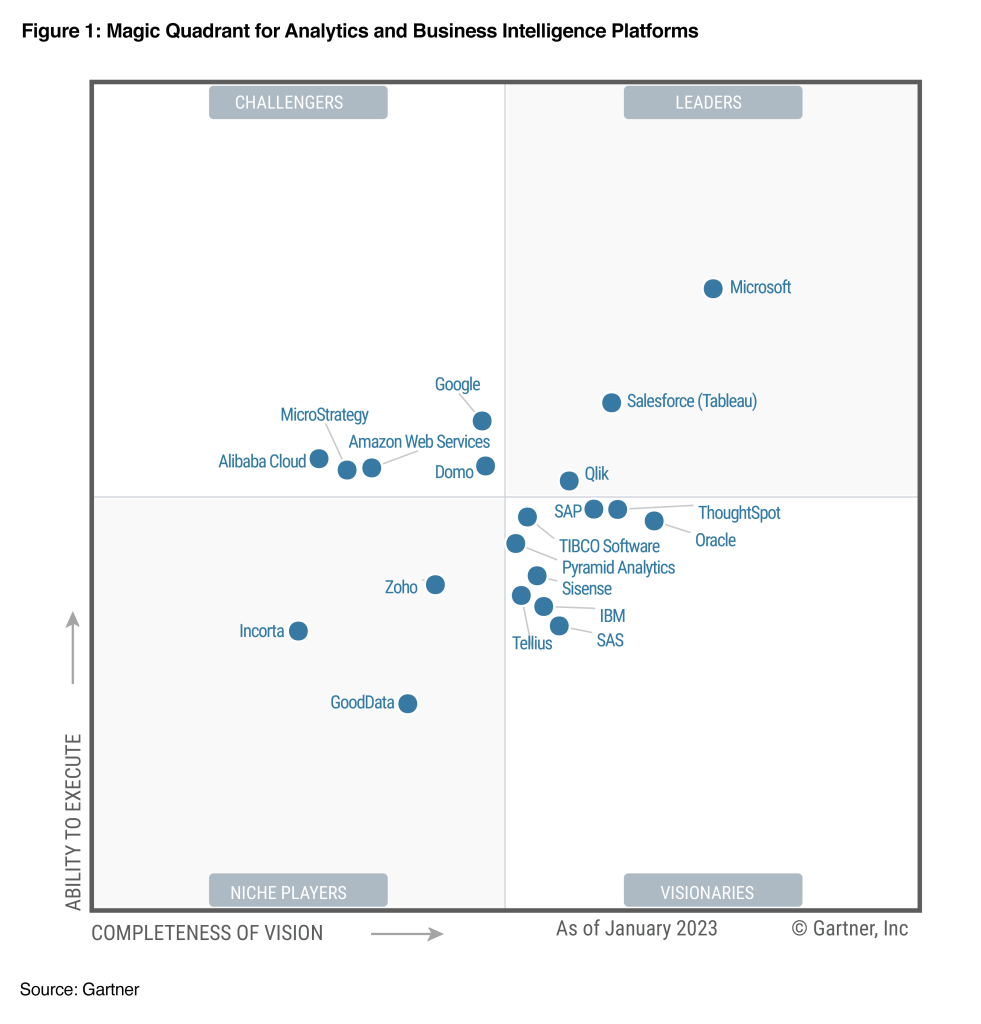
Source: Gartner Research Publications
*Gartner does not endorse any vendor, product or service depicted in its research publications, and does not advise technology users to select only those vendors with the highest ratings or other designation. Gartner research publications consist of the opinions of Gartner’s research organization and should not be construed as statements of fact. Gartner disclaims all warranties, expressed or implied, with respect to this research, including any warranties of merchantability or fitness for a particular purpose.
Q6: Where can I Get Power BI?
There are 2 main components you need for Power BI (and one optional tool):
Power BI Desktop Application – This is a standalone program you download and install on your PC.
Power BI Desktop enables you to get data from multiple sources. You can then edit/clean, add calculations, model it and then create your dashboards and reports. From there you can either share the Power BI Desktop files like you would share an Excel file, or you can upload the reports and dashboards to the Power BI Service where you can share them online on any device.
Download the Power BI Desktop tool here. Tip: check whether you’re running 32-bit or 64-bit Excel (File tab > Account > About Excel) and install the same version for Power BI Desktop.
Power BI Service (online/cloud based) - You can also build dashboards direct in the Power BI Service by uploading your data, but your data needs to be in the perfect format and you can’t do any editing/cleaning, modelling or calculations on it before building your charts and visualizations.
Typically you’ll build your reports in Power BI Desktop and then upload the completed reports and dashboards to the Power BI service for sharing.
If you haven’t already got a Power BI account you can get one here. This gives you access to the online Power BI Service. Note: requires a work or school email address.
They’re all FREE!
Note: There is also a Pro license for Power BI available for a low monthly fee (US$10/mth) which gives you access to more storage and sharing of Dashboards using the online Power BI Service. The free license is adequate for single users/personal use. And for corporates there is a Power BI Premium license which allows unlimited sharing of Dashboards. More pricing info here.
Choose Your Course Bundle
- Power BI
- Online Only
USD $199Add to cart
USD $199Add to cart
- Online + Download
USD $398Add to cart
USD $398Add to cart
 Power BI Videos 5h 19m
- Download Supporting Files & Data
- Download Completed Power BI Desktop Files
- 12 Months of Support
 Power BI Videos 5h 19m
- Power BI
+
Power Query - Online Only
USD $278Add to cart
USD $278Add to cart
- Online + Download
USD $556Add to cart
USD $556Add to cart
- Everything in the Power BI Course
- Power Query Videos 5h 30m
- Power BI
+
Power Pivot & DAX - Online Only
USD $294Add to cart
USD $294Add to cart
- Online + Download
USD $589Add to cart
USD $589Add to cart
- Everything in the Power BI Course
- Power Pivot & DAX Videos 5h 23m
- Power BI
+
Power Query
+
Power Pivot & DAX - Online Only
USD $413Add to cart
USD $413Add to cart
- Online + Download
USD $828Add to cart
USD $828Add to cart
- Everything in the Power BI Course
- Everything in the Power Query Course
- Everything in the Power Pivot & DAX Course
- Power BI
+
Excel Dashboards - Online Only
USD $318Add to cart
USD $318Add to cart
- Online + Download
USD $637Add to cart
USD $637Add to cart
- Everything in the Power BI Course
- Dashboard Course Videos 5h 30m
- 12 Months of Dashboard Support
- Homework Project
- 3 Sample Dashboards
- Power BI
+
Excel Dashboards
+
Power Query
+
Power Pivot & DAX - Online Only
USD $572Add to cart
USD $572Add to cart
- Online + Download
USD $1,147Add to cart
USD $1,147Add to cart
- Everything in the Power BI Course
- Everything in the Dashboards Course
- Everything in the Power Query Course
- Everything in the Power Pivot & DAX Course