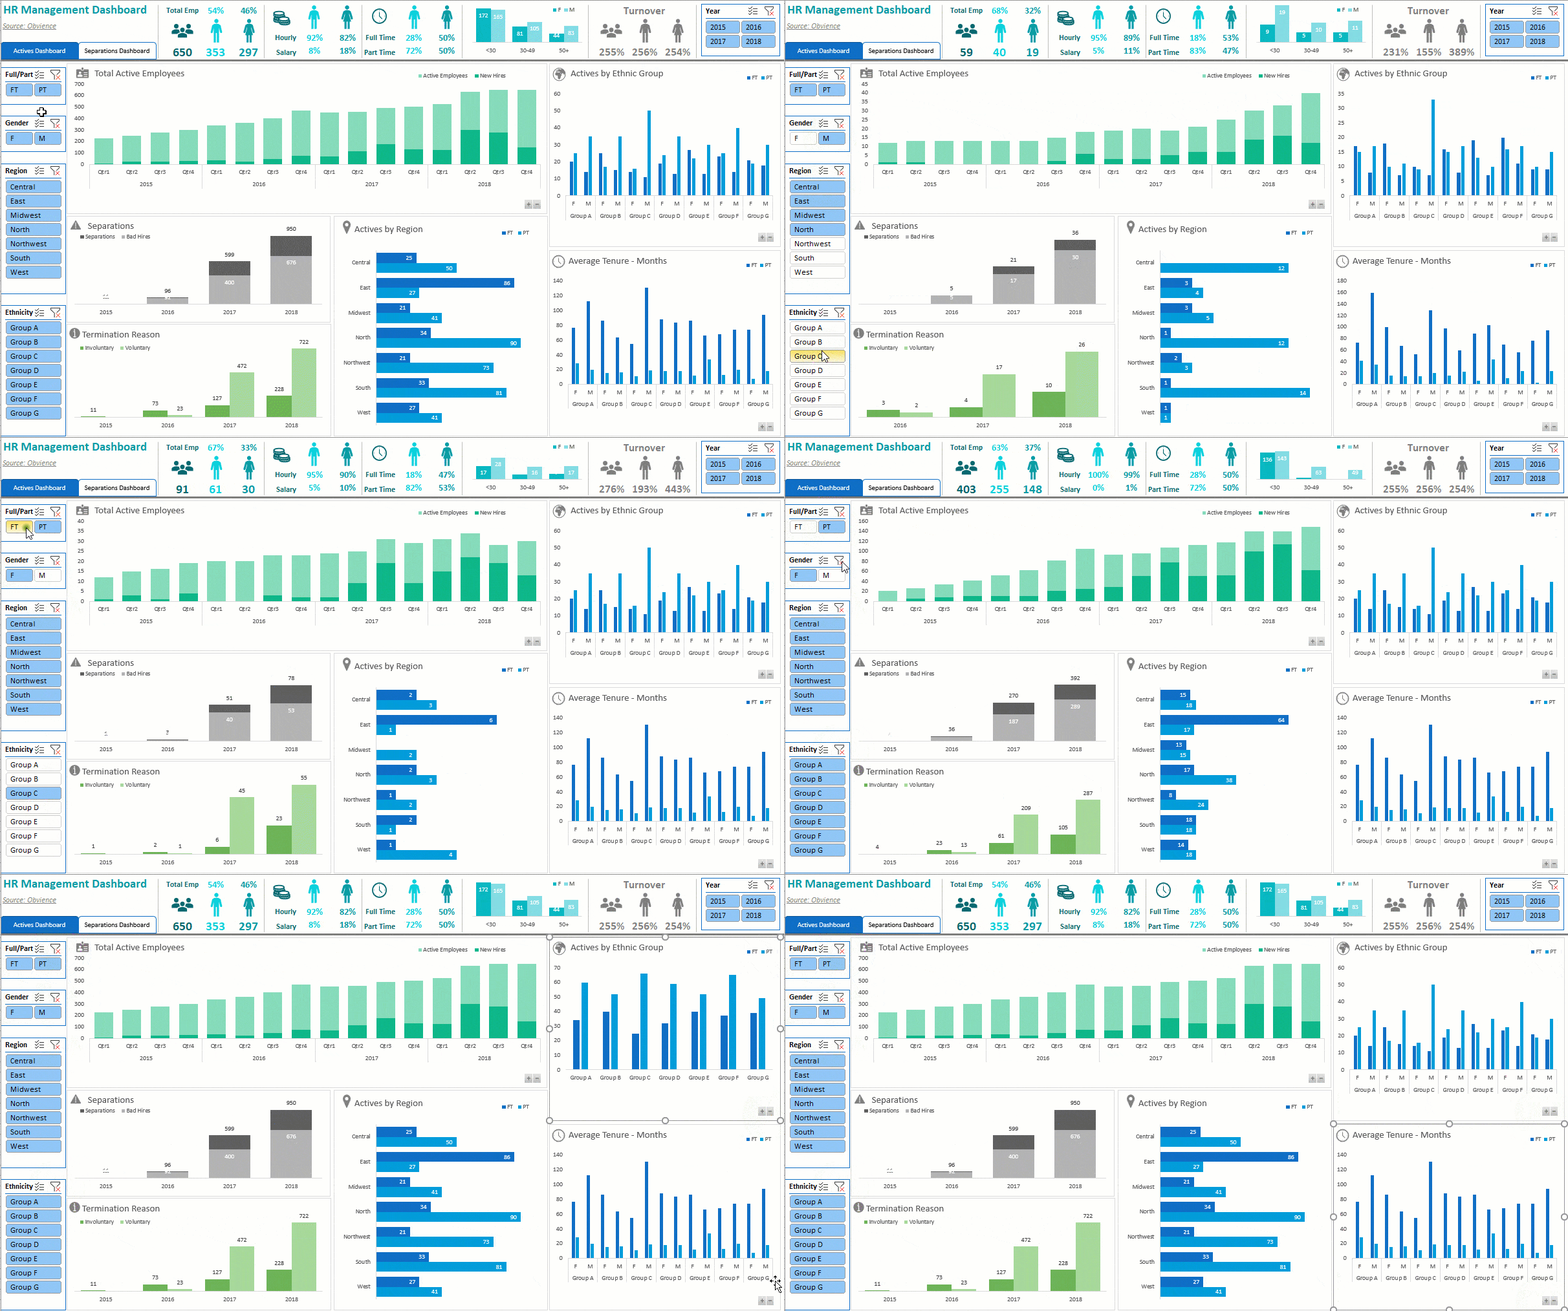

It’s time to change that. With dynamic, interactive dashboards, you’ll turn dry data into insights that captivate your audience and update with a single click.
- Streamline your workflow.
- Build dashboards that wow your team or clients.
- Save hours while delivering professional, polished results.
Why Excel Dashboards?
A well-crafted dashboard is more than charts and tables—it’s a game-changing tool for:
- Delivering insights and analysis in one interactive page.
- Managing projects, tracking KPIs, or planning budgets.
- Streamlining updates with ease.
Key features:
- Concise Presentation: All critical information displayed on one page for quick reference.
- Visual Clarity: Key trends and comparisons presented graphically or in succinct tables.
- Actionable Insights: Direct conclusions aligned with your objectives.
- User Interactivity: Empower users to filter data and switch views seamlessly.
- Effortless Updates: Designed for quick and easy updates, often at the click of a button.
What the Excel Dashboard Course Will Do For You
This course is meticulously crafted to teach you the techniques needed to create impressive dashboards that set you apart professionally. You'll learn to:
- Build from the Ground Up: create dashboards for any business and data type.
- Save Time: Develop reports that are quick to update, allowing you to focus on analysis rather than data entry.
- Enhance Interactivity: Create dashboards where users can filter by product, time period, or any parameter you choose.
- Improve Readability: Utilize design best practices to make your reports easy to read and interpret.
- Meet Audience Needs: Learn the five key questions to ask during the planning stage to ensure your dashboard aligns with user expectations.
- Choose the Right Charts: Gain proficiency in selecting the most effective chart types for your data.
- Present Professionally: Apply visualization techniques that give your reports a polished, professional appearance.
What Our Course Members Are Saying
Mynda,
I must tell you that my dad bought me the dashboard and formula courses. So far, I have done the dashboard course and in less than a week EVERYONE in my department has been shocked by how much better my excel skills have gotten! I have become the go to person for all excel projects. I love it.
I’ve created better ways for our department to look at our metrics, I am sure you can see below what my position is and what I do for work. Since taking your course our metrics are much cleaner and much easier to read an interpret!
On top of that the course was LIGHTNING fast. I wasn’t wasting any time. I was learning the whole time and then was able to apply what was learned right away. I will for sure be back for more of your courses in the future to further my excel education, keep up the great work!
Matt Flynn - Business Analyst
What You Get in the Course
- 5.5 hours of video tutorials: Fast-paced, to-the-point lessons designed to get you building your own dashboards quickly. Even if you’re short on time, the bite-sized tutorials and lifetime access mean you can learn at your own pace.
- Downloadable Excel Files: Access the actual Excel files used in the tutorials, complete with notes and links to additional resources. If you ever feel stuck, these files act as your guide to retrace every step effortlessly.
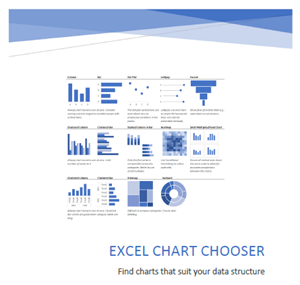
Chart Chooser PDF: A handy guide to help you select the most appropriate charts for your data. No more second-guessing which chart fits your data best — this PDF makes it simple and straightforward.
- Sample Dashboards: Three sample dashboards to inspire and guide your creations. Whether you’re struggling with design ideas or unsure where to start, these examples provide a clear vision to help you create your own polished dashboards.
- Homework Challenge: Practice your skills by creating a dashboard and receive feedback. Worried about applying what you learn? This challenge gives you hands-on experience, so you’re confident in your abilities.
- 12 Months of Support: Access to a dedicated support forum where you can ask questions and get answers from the instructor and fellow students. If you hit a roadblock, you won’t be alone — help is always just a post away.
- Flexible Learning: 24/7 online access to tutorials, with the ability to pause, rewind, and replay as needed. Got a busy schedule? No problem. Learn whenever and wherever it’s convenient for you.
- Certificate of Completion: A professional credential to showcase your skills to employers or clients. Stand out in the job market with proof of your new, in-demand expertise.
- Accessibility Features: The course includes English subtitles and a fully searchable transcript, making it easier to follow along and quickly find specific topics or instructions.
Course Syllabus
Excel Dashboards
Session 1: Getting Started0:14:40
| 1.01 | Introduction | 0:04:04 | ||
| 1.02 | Data Preparation | 0:03:35 | ||
| 1.03 | Design Principles | 0:07:01 |
Session 2: Pivot Dashboards0:26:23
| 2.01 | PivotTables for Analysis | 0:06:09 | ||
| 2.02 | Pivot Charts | 0:09:22 | ||
| 2.03 | Slicers | 0:06:16 | ||
| 2.04 | Updating Pivot Based Dashboards | 0:04:36 |
Session 3: Formula Dashboards1:00:55
| 3.01 | Formulas for Analysis | 0:12:21 | ||
| 3.02 | Regular Charts | 0:05:49 | ||
| 3.03 | Form Controls | 0:11:06 | ||
| 3.04 | Slicers for Formulas | 0:08:21 | ||
| 3.05 | Updating Formula Based Dashboards | 0:23:18 |
Session 4: Distributing0:36:54
| 4.01 | Distributing Dashboards | 0:01:52 | ||
| 4.02 | Protecting Excel Files | 0:08:17 | ||
| 4.03 | Embed in PowerPoint | 0:02:57 | ||
| 4.04 | Excel Web App | 0:12:47 | ||
| 4.05 | SharePoint Page | 0:02:09 | ||
| 4.06 | Custom Passworded Views | 0:08:52 |
Session 5: Chart Library3:10:49
| 5.01 | Choosing Charts | 0:03:07 | ||
| 5.02 | Create Regular Charts from PivotTables | 0:11:25 | ||
| 5.03 | Ideas (365 Only) | 0:05:43 | ||
| 5.04 | Adding Series to Charts | 0:06:19 | ||
| 5.05 | Charts & Tricks for Trending | 0:08:33 | ||
| 5.06 | Smoothing Data | 0:02:40 | ||
| 5.07 | Actual vs Target Charts | 0:11:22 | ||
| 5.08 | Bullet Charts | 0:08:14 | ||
| 5.09 | Small Multiples & Panel Charts | 0:02:35 | ||
| 5.10 | Dot Plots, Dumbbells & Lollipops | 0:09:48 | ||
| 5.11 | Highlight Chart Min & Max | 0:09:19 | <||
| 5.12 | Frequency Distribution | 0:04:52 | ||
| 5.13 | Sparklines & Mini Charts | 0:14:02 | ||
| 5.14 | Map Charts (2019/365) | 0:06:24 | ||
| 5.15 | Conditional Formatting | 0:4:33 | ||
| 5.16 | Heatmaps | 0:03:36 | ||
| 5.17 | Visualising Parts to a Whole | 0:04:02 | ||
| 5.18 | Symbols in Charts | 0:05:27 | ||
| 5.19 | Dynamic Labels | 0:08:34 | ||
| 5.20 | Lookup Charts | 0:07:00 | ||
| 5.21 | Cross Filter & Highlight | 0:09:28 | ||
| 5.22 | Scroll and Sort Table | 0:14:08 | ||
| 5.23 | Chart Titles | 0:09:09 | ||
| 5.24 | Custom Number Formats | 0:07:50 | ||
| 5.25 | Tabs Using Shapes & Hyperlinks | 0:06:08 | ||
| 5.26 | Formatting & Chart Alignment Tricks | 0:06:31 |
Learn with Support from a Recognized Expert

Your instructor, Mynda Treacy, is 10+ year a Microsoft MVP and Co-founder of My Online Training Hub. With over 25 years of experience, she’s helped thousands of professionals transform their Excel skills.
When you enroll in her Excel Dashboards Course, you’re not just getting high-quality tutorials—you’re also gaining access to Mynda Treacy’s personalized support and mentorship.
As a seasoned Excel trainer, Mynda is passionate about helping students succeed. Throughout the course, you’ll have opportunities to:
- Ask Questions: Get answers to your Excel challenges directly from Mynda.
- Receive Expert Feedback: Gain insights and tips to refine your skills.
- Be Part of a Learning Community: Join like-minded professionals and learn through shared experiences and discussions.
This isn’t just a course — it’s a learning journey with a trusted mentor by your side. Mynda’s guidance ensures you’re never stuck or unsure of how to move forward.
And with Mynda’s streamlined teaching methods, you’ll gain Excel Dashboard skills faster than you ever thought possible.
This video gives you a sneak peek into her clear, practical, and engaging teaching style.
Who Is This Course For?
This course is ideal for individuals who:
- Regularly prepare reports that require frequent updates.
- Want to learn how to build interactive dashboard reports.
- Are seeking to change careers or apply for new job opportunities.
- Work with charts or large volumes of data.
- Import data into Excel from various sources.
- Struggle with choosing the best chart types to display their data.
Prerequisites:
- Have access to Excel 2013 or later.
- Basic proficiency in building and applying formulas in Excel.
- While not mandatory, familiarity with PivotTables and PivotCharts is beneficial.
Notes:
- Mac Users: This course is filmed in Excel for PC, however if you're fairly savvy you will be able to map the menus you see in the videos to your Mac equivalents. Many Mac users have successfully taken this course. The Dashboard concepts and most of the formulas are applicable to any version of Excel.
- Beginners: This course is not for complete beginners but if you’ve put together any type of report in Excel before then you will definitely benefit from the time saving tips and data visualisation techniques I share with you.
Ready to Level Up Your Excel Skills?
Excel dashboards are in-demand in today’s data-driven world. Enroll in this course to:
- Gain the skills to create interactive, professional-quality dashboards.
- Impress employers and clients with dynamic, insightful reports.
- Transform your reporting process and take your career to new heights.
Join the Excel Dashboard Course by Mynda Treacy and start building dashboards that make an impact today!
Choose Your Dashboard Course Combination
- Dashboards
- Online Only
USD $199Add to cart
USD $199Add to cart
- Online + Download
USD $399Add to cart
USD $399Add to cart
- Dashboard Course Videos 5h 30m
- 5 Sample Dashboard Files
- Home Work Project
- Dashboards
+
Power Query - Online Only
USD $278Add to cart
USD $278Add to cart
- Online + Download
USD $557Add to cart
USD $557Add to cart
- Everything in the Dashboards Course +
- Power Query Course 5h 30m
- Dashboards
+
Power Query
+
Power Pivot & DAX - Online Only
USD $413Add to cart
USD $413Add to cart
- Online + Download
USD $828Add to cart
USD $828Add to cart
- Everything in the Dashboards & Power Query Courses +
- Power Pivot & DAX Course 5h 23m
- Dashboards
+
Premium - Online Only
USD $318Add to cart
USD $318Add to cart
- Online + Download
USD $638Add to cart
USD $638Add to cart
- Everything in the Dashboards Course +
- Excel 16, 19 and 24/O365 Course
- Word 16, 19 and 24/O365 Course
- PowerPoint 2024 & 365 Course
- Access to new Microsoft Office Training
- Dashboards
+
Premium
+
Power Query - Online Only
USD $437Add to cart
USD $437Add to cart
- Online + Download
USD $876Add to cart
USD $876Add to cart
- Everything in the Dashboards & Premium Courses +
- Power Query Course Videos 5h 30m
- Dashboards
+
Premium
+
Power Pivot & DAX - Online Only
USD $453Add to cart
USD $453Add to cart
- Online + Download
USD $909Add to cart
USD $909Add to cart
- Everything in the Dashboards & Premium Courses +
- Power Pivot & DAX Course Videos 5h 23m
- Dashboards
+
Premium
+
Power Query
+
Power Pivot & DAX - Online Only
USD $572Add to cart
USD $572Add to cart
- Online + Download
USD $1,148Add to cart
USD $1,148Add to cart
- Everything in the Dashboards & Premium Courses +
- Power Query Videos 5h 30m
- Power Pivot & DAX Videos 5h 23m
What Are The Premium, Power Query and Power Pivot & DAX Courses?
- Premium is our Excel, Word and PowerPoint courses bundled together
- Power Query gets data from almost any source (a database, the web, Excel, Sharepoint, Salesforce, OData etc), and loads it into Excel or Power Pivot for analysis, report preparation or export.
- Power Pivot can import millions of rows of data, create relationships between different data sources, and build interactive reports.
Notes
- Online Only : 12 months online access to the course(s)
- Online + Download : 12 months online access to the course(s) + download the course videos to keep
- GST : Prices are exclusive of GST for Australian customers.
- Videos will be available for download after the 30 day Money Back Guarantee period ends.
- Membership and access to the training materials is for one person only. Logons are not to be used by multiple people.
- Downloaded videos are to be used only by the registered member, they are not to be transferred/shared amongst other people.
- You can request a refund provided that no more than 30% of the course videos have been watched.
Frequently Asked Questions
Is this website safe to buy from?
 |
Yes it is. Our site is monitored and protected by Sucuri a leading authority in malware detection and prevention. You can click on our Sucuri badge to get a live status on our site. |
|
|
We use SSL to make sure any information you send us is securely encrypted. Hover your mouse over, or click on, the Secured by Sectigo logo to learn more. |
| We hold a business account with Stripe. Stripe can process your credit card transactions using the highest level of security. | |
 |
We also hold a business account with Paypal. They too process your credit card transactions using the highest level of security. |
How can I pay?
You can use your credit card, Paypal account (if you have one) or if you are an Australian customer we can arrange an EFT. We can also accept international money transfer from outside Australia.
If you need an invoice before payment, no problem, just let us know.
We're also happy to complete any paperwork your company, or government may require.
How many payments are there?
Just one. The prices above are all you will pay for 12 months access to the course(s).
Can I download the course videos to keep?
Yes, just choose the Online + Download option above.
How long do I have access to the courses?
If you choose the Online option your membership and access to the course lasts for 12 months from date of purchase.
But if you choose the Online + Download option, your access to the online course lasts for 12 months, and you get to download and keep the course videos forever
Can I purchase my own combination of courses?
Yes, we're happy to work with you to find a combination that you want. Please contact us to have a chat.
Can I purchase the courses for a large number of staff?
Certainly. Please contact us to discuss the options for multi-user pricing.
Can I purchase the courses for use in our own LMS?
Yes. We can provide the courses for you to integrate into your own Learning Management System. Please get in touch with us to talk over the options.
What guarantee is there?
If you aren't happy with the course within the first 30 days, just contact us for a full refund.
All we ask is that you really give the course a good go. Watch the videos, go through the workbooks, ask us questions. If you honestly feel it wasn't worth it, just get in touch.

Love It or Get Your Money Back : Guaranteed

Here's the deal:
Enrol now and take the course. I mean REALLY take the course. Download the workbooks, watch up to 30% of the videos, ask me questions. Get as much out of it as you can.
Once you’re done, ask yourself, "was this worth it?"
If your answer isn't a resounding YES, then let me know within 30 days and I'll refund you, no questions. So you literally have nothing to lose.


 Chart Chooser PDF: A handy guide to help you select the most appropriate charts for your data. No more second-guessing which chart fits your data best — this PDF makes it simple and straightforward.