
March 17, 2026
Excel PivotTables: How to Analyze Data in Seconds
PivotTables are one of the most powerful tools in Excel for analysing data. Yet they are also one of the features
Read More
March 17, 2026
PivotTables are one of the most powerful tools in Excel for analysing data. Yet they are also one of the features
Read More
September 9, 2025
Do you spend hours every month building Excel reports full of repetitive formulas? You're not alone. Many professionals use hundreds
Read More
September 24, 2024
PivotTables are one of the most powerful tools in Excel for summarizing and analyzing data, but there are many hidden
Read More
October 31, 2023
Slicers are a fantastic tool to get a filtered view of your data and visuals. But by default, they get
Read More
July 6, 2023
One of the downsides of PivotTables is they have a very distinctive look. Some might even say they’re ugly. In
Read More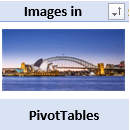
June 27, 2023
With Microsoft 365 we can now include images in Excel PivotTables, as well as built in data types like Stock
Read More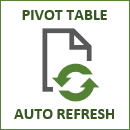
July 22, 2021
In this tutorial we’re going to look at the options we have available to auto refresh PivotTables in Excel without
Read More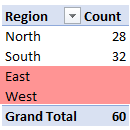
June 16, 2021
Show Items with no Data in PivotTables is a handy setting that allows you to show items in the PivotTable
Read More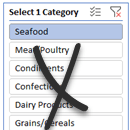
November 19, 2020
There’s no built-in way we can force Excel Slicers to single select, but we can use some crafty tricks to
Read More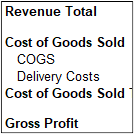
July 30, 2020
Creating an Excel PivotTable Profit and Loss statement is surprisingly easy. And because it’s a PivotTable you can team it
Read More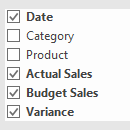
July 16, 2019
The Excel PivotTable field list automatically appears in the task pane on the right-hand side of the Excel window when
Read MoreOctober 11, 2018
There are a couple of ways you can hide blanks in Excel PivotTables. To be clear, the ‘blanks’ I’m referring
Read More
June 25, 2018
Excel Slicers are great, but they’re a bit on the chunky side and that can be a pain when you’re
Read More
April 25, 2018
With PivotTable Quick Explore we can filter and drill down in PivotTables and Pivot Charts without the field list exposed.
Read More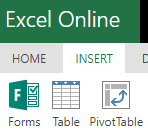
March 14, 2018
Inserting PivotTables in Excel Online is now possible. It’s still in its infancy with many features you may be used
Read More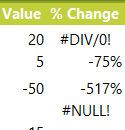
November 6, 2017
Obviously, we don’t want our PivotTables littered with #DIV/0! and #NULL! errors if we’re presenting them in a report (like
Read More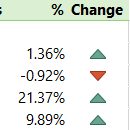
November 2, 2017
PivotTables can make quick work of summarising and analysing data and they have some handy built in percentage calculations available
Read More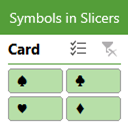
July 11, 2017
Did you know you can display symbols in Excel Slicers? That’s right, Slicers aren’t just limited to listing boring old
Read More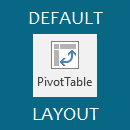
June 13, 2017
New in Excel 2019 onward and Microsoft 365 is the ability to set a PivotTable default layout, which can save
Read More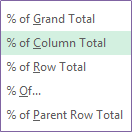
September 7, 2016
The Excel PivotTable Show Values As menu has a load of handy instant calculations you can use. For example you
Read More
April 11, 2016
In Excel 2007 Microsoft thought they’d get clever and impose nested row labels in our PivotTables: If you’re a PivotTable
Read More
April 11, 2016
If you put a field in the values area of a PivotTable and it defaults to COUNT as opposed to
Read More
November 17, 2015
Updated 16 May 2023 Note: This does not apply to Power Pivot aka Data Model PivotTables. When you create a
Read More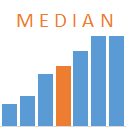
October 27, 2015
Unfortunately there’s no built in way to calculate the median in a PivotTable. The approach is different depending on whether
Read More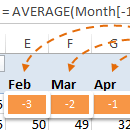
July 28, 2015
A while back I wrote about how to create Excel PivotTable Calculated Items using the conventional approach of referencing the
Read More
May 26, 2015
I’ve always thought after inserting a PivotTable that Excel should ask “would you like a PivotChart with that?”. I think
Read More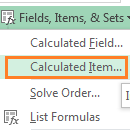
May 12, 2015
Inserting Excel PivotTable Calculated Items is a great way to analyse your data and automatically incorporate that analysis in your
Read More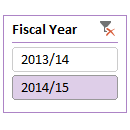
May 6, 2015
There’s no built-in way to create Excel Slicers for fiscal years, however the solution is easily achieved by adding an
Read More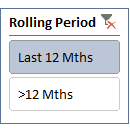
May 6, 2015
Excel Slicers for rolling periods, for example; the last 12 months, requires a column in your source data that looks
Read More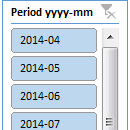
April 28, 2015
In this tutorial we’re going to look at how we can create a single Excel Slicer for Year and Month,
Read More