Excel Slicers for rolling periods, for example; the last 12 months, requires a column in your source data that looks up the date and compares it to today’s date to see if it falls into the current period.
Download the Workbook
Enter your email address below to download the sample workbook.
Watch the Video
Watch right to the end to see the bloopers!
Creating Excel Slicers for Rolling Periods
Below is my data: in column A I have the date for each record and in column C I use an IF function to compare today’s date (returned from your computer’s clock using the TODAY() function in cell F2), to the date in column A to see if it falls within the last 12 months.
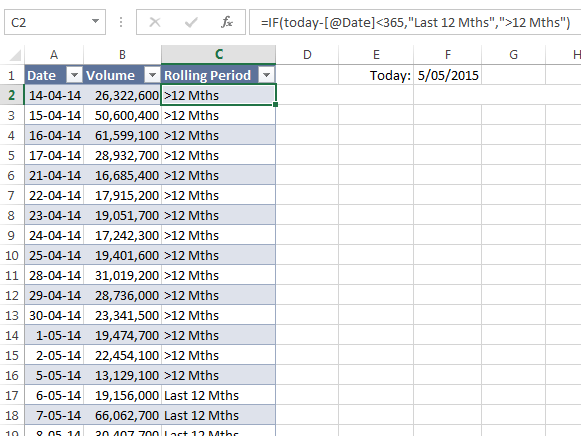
The formula:
=IF(today-[@Date]<365,"Last 12 Mths",">12 Mths")
Note: today is a named range for cell F2 which contains the formula =TODAY(). This formula returns the date from your computer’s clock.
English Translation of the IF formula:
=IF (today’s date minus [the date in column A] ) is less than 365, then enter the text "Last 12 Mths", otherwise enter the text ">12 Mths"
Now we can build the PivotTable and or Pivot Chart and add a Slicer for the Rolling Period:
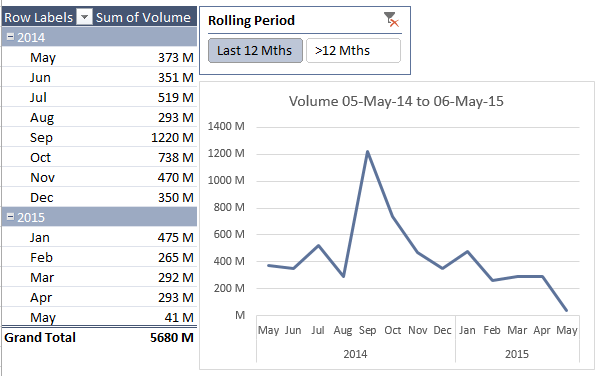
And because I’ve grouped my data by month I don’t have the day detail so I want to make it absolutely clear which period the chart is displaying by inserting a custom chart title that automatically displays the date range.
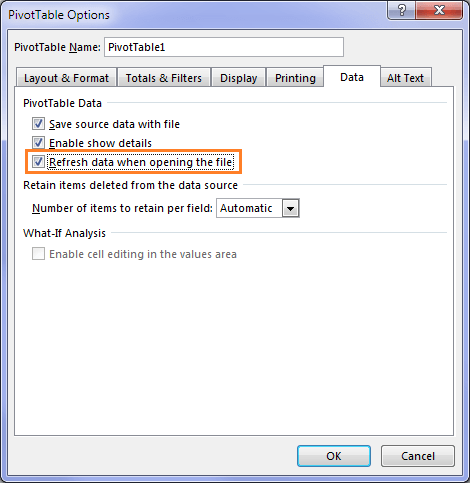
Warning: Don’t forget to refresh the PivotTable/Pivot Chart so that it displays the correct ‘last 12 months’.
If your PivotTable is pulling in the data from another system you could turn on the ‘Refresh data when opening the file’ in the PivotTable Options menu:


Exactly what I was looking for to get rolling data! Thanks Mynda!
Glad it was helpful, Jim!
Hi Mynda
I am new to excel and am trying to get a rolling 12 hours is this possible? My data is collected every 60 seconds from a plc and I would like a chart showing the last 12 hours or from 6am to 6pm and 6pm to 6am would be even better
Thanks
Hi Craig,
Can you please upload a sample file with your data and a description of what you’re after? Use our forum to upload (create a new topic)
Hi Catalin
I have posted the question in the forum
Thank you
Craig
Fantastic ! My out most praises for such great and clear media. Thank you very much.
🙂 you’re welcome!
Is it possible to create a slicer for 4-week, 12-week, 26 week and 52 week rolling? I understand from this post how to make 52 week but the 4/12/26 is a bit more challenging.
The goal is to look at sales trends for different time periods easily with one click instead of selecting 26 week endings at once.
Maybe a Timeline would suite you better. I mention them briefly at the end of this tutorial: https://www.myonlinetraininghub.com/create-a-single-excel-slicer-for-year-and-month
My data is usually tracked by Year and Month – I do not track Days. Is there a way to do this with a separate year and month column or does the date have to be formatted year-month-day in the same column?
Hi Ryan,
You need a numeric field to check if the date in your data is less than 12 months ago and if you only have year and month then my guess is that’s a text field, not a numeric field. You could change it to a numeric field and use that, but you’d have to change the IF formula to suit, or you could just add a column that represents a proper date dd/mm/yyyy or mm/dd/yyyy.
If you get stuck please post your question and sample Excel file on our forum.
Mynda
you can use a nifty function called EDATE
=IF(RefDate<EDATE(TODAY(),-12),"12 Mths”)
Where RefDate is the date you want to evaluate from.
Can be start, middle or end of the month depending on how you want to evaluate your rolling periods i.e. into the past or forecast for the future.
Although I kinda prefer using -13 months because I like to see current month vs same month in the prior year. 😉
Excellent tutorial–worked flawlessly. I’ve been using Excel for decades and have never used the Slicer and “structured tables”. Very useful and now I’ll start to use them.
Great to hear, Phillip 🙂
Hi Mynda, how did you insert a custom chart title that automatically displays the date range?
Hi Rachel,
I used a dynamic text label as described here: https://www.myonlinetraininghub.com/excel-dynamic-text-labels
Mynda
Hi Mynda,
Thank you for publishing this article and for your prompt reply. Learning how to use slicers to create a rolling 3-week PivotChart / learning how to create dynamic chart titles were both very useful skills to learn. You are a lifesaver!
Best,
RF
Glad you found them useful, Rachel 🙂
Hi Mynda,
I ran into a similar situation recently and tried to deploy a similar approach as you presented here. However I gave up and decided to use a not-so-effective approach simply because
“Warning: don’t forget to refresh the PivotTable/Pivot Chart so that it displays the correct ‘last 12 months’.”
Sadly but true, users of my report are not familiar with Excel. I can by no mean assure that they will “refresh” the Pivot Table after they change the variable of date (in my case, last 12 months depends on which dates user selected). Although Macro can do the job easily, the problem is ONLY when the macro is enabled and which requires USER’s co-operation. @_@
My not-so-effective approach is to create a Slicer of months in YYYYMM, so that user can select whatever periods they wish by simply click-and-drag. You can imagine how many icons could be there in a single slicer. This is not perfect but at least users are aware of the changes they made.
Cheers,
Hi MF,
On the upside, if you set the refresh to happen on File Open then you shouldn’t have this problem. I guess if the user is also adding the new data then you need them to refresh it.
If it weren’t for the Users… 😉
Mynda
HI Mynda,
Thanks for your suggestion… however that does not work in my case as my “rolling month” is based on the selection made by users, not on =TODAY().
MF