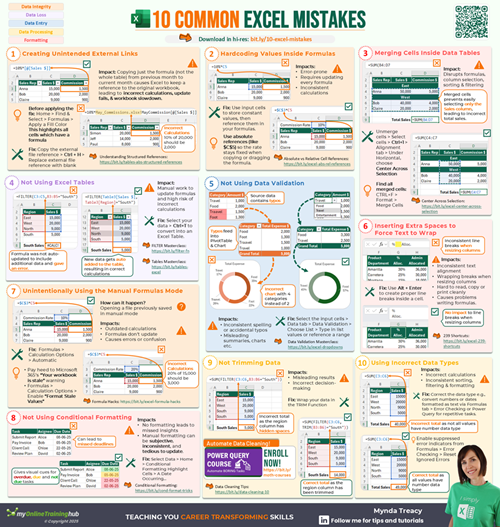
I’ve received a lot of Excel files from our members over the years and I see the same mistakes time and again.
In this post I’m going to list the 10 things you should never do in Excel and what to do instead to avoid trouble when working in Excel.
Watch the Video

Download Workbook and Cheat Sheet
Enter your email address below to download the sample workbook.

1. Merge & Centre Cells
99% of the time you don’t need to merge and centre cells!
The problem with merged and centred cells is they interfere when selecting a range of cells, which is super annoying.
Plus, they can prevent you from sorting data and copying and pasting and can cause formula errors.
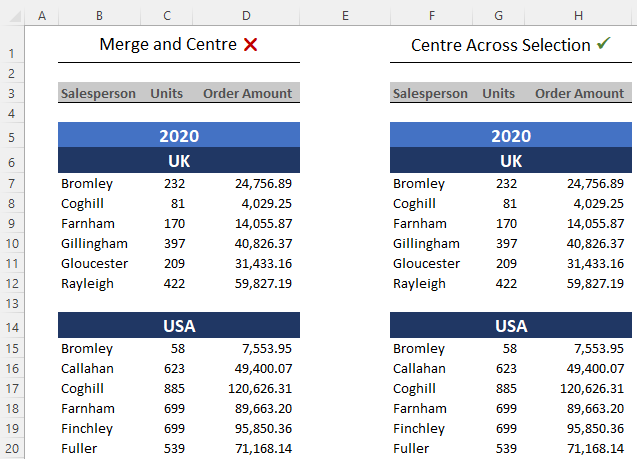
Solution: use Centre Across Selection.
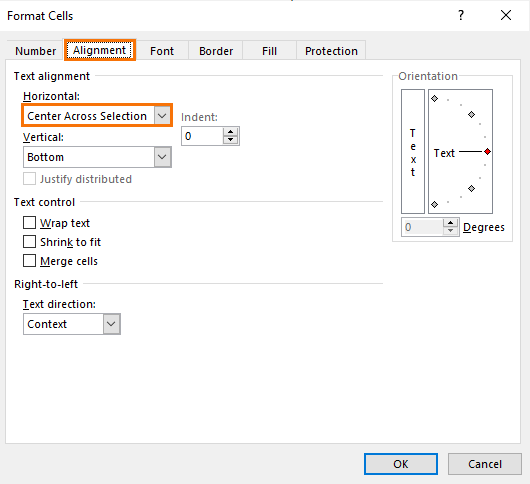
It looks identical to merged cells, but it doesn’t have any of the limitations.
In the image below you can’t tell the difference between the merged cells and those using centre across selection:
Note: there’s no equivalent for centre across selection for vertical alignment, so you may still need to use Merge and Centre for merging across rows.
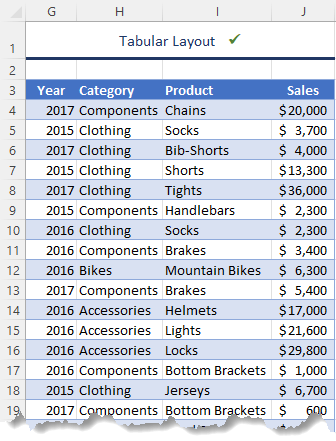
2. Non-Tabular Layout
One of the BIGGEST mistakes I see is data in the wrong layout like that below:
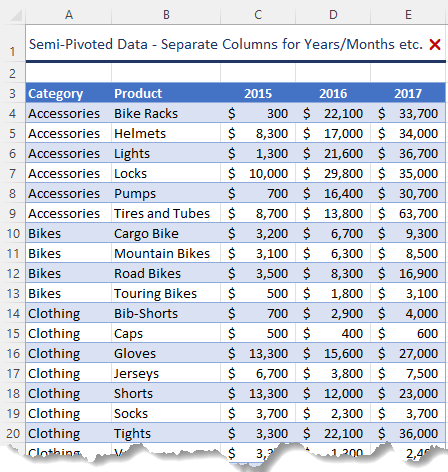
At first glance the layout actually looks quite good, however the year values are split across multiple columns.
When you do this, it makes it difficult to use the built in tools like PivotTables and functions designed to work with data in a tabular layout.
This is just one example of the wrong data layout. There are many more here examined here : Excel tabular data format.
Solution: The correct layout is a tabular format with just one column for the values and another for the year:
Thankfully, you can easily fix this data layout using Power Query to unpivot the year columns.
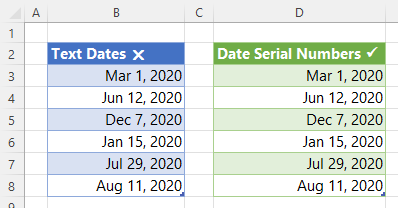
3. Dates Formatted as Text
Dates formatted as text, which usually come from files exported from external systems, can be tricky to detect because they look the same on the face of the cell and even in the formula bar:
However, if you use the keyboard shortcut CTRL+Back Quote, dates entered correctly will display their date serial number as shown below in column D:
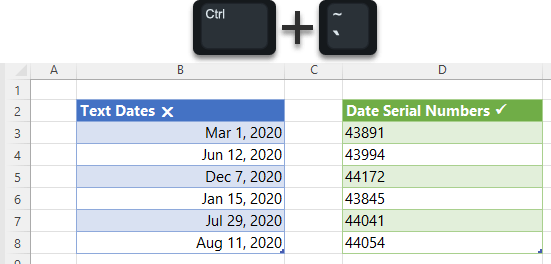
To revert back to the date format, CTRL+Back Quote again.
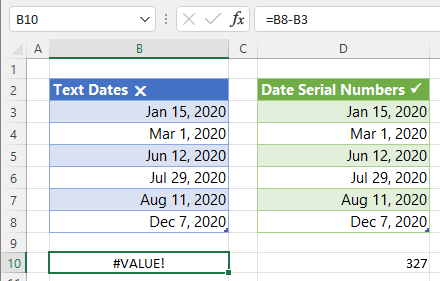
The reason dates formatted as text are problematic is because you can’t reference them in formulas.
For example, if I wanted to calculate the number of days between the first and last dates I get an error with the text dates, but the proper date serial numbers correctly calculate.
Solution: Convert text dates to date serial numbers. Click here for several ways to fix dates formatted as text in Excel.
4. External Links
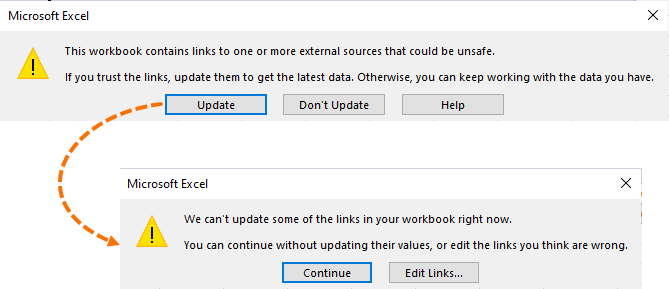
That error warning is so frustrating that I could just leave it at that, but it’s also important to point out that the following functions do not work when referencing closed external workbooks:
Solution: If you need to reference data in an external file, then a better option is to use Power Query to get the data and bring it into your file. You can then refresh the query without opening the external file to get any updates and your formulas won’t break.
5. Formatting Whole Columns/Rows
It’s quick and easy to apply formatting to the whole column or row, but this just adds unnecessary data to your file, making your file size bigger than it needs to be.
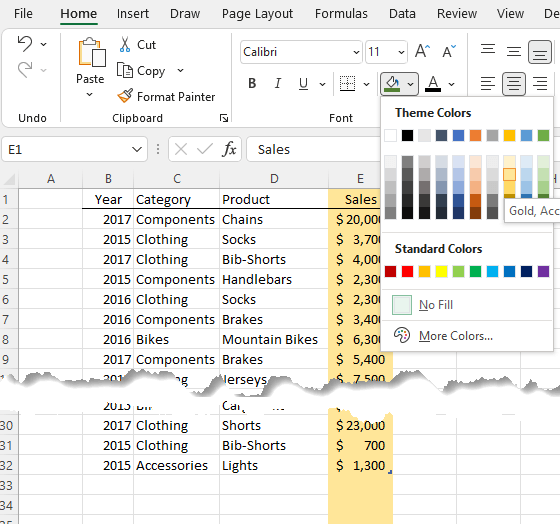
Solution: Format your data in an Excel Table (CTRL+T) and choose a format from the style gallery:
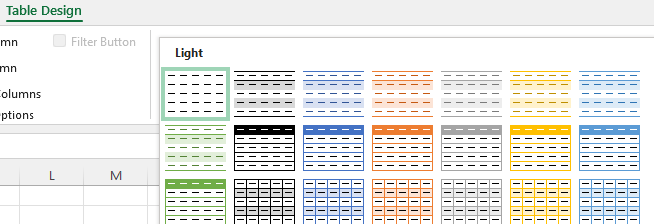
Or if you prefer to set your own format, choose ‘None’ (top left option in the style gallery). When you apply formats to the column of a table, they’re automatically applied to any new rows you add.
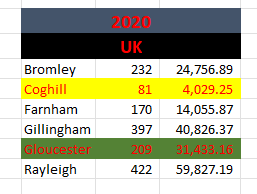
6. Formatting to Encode Data
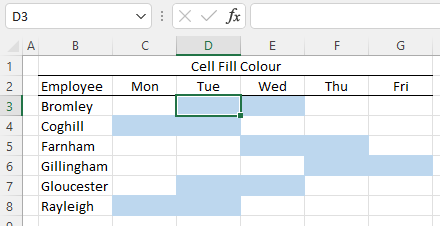
It’s common practice to use cell fill colours to encode data.
The problem with this is you can’t reference cell fill colour in formulas, which makes it difficult to count data that matches a fill colour.
Take the table below, we can’t easily count how many days of the week are shaded blue:
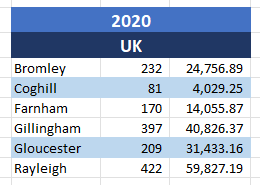
Solution: use numbers or text in the cells and apply conditional formatting that shades the cells containing a specified value:
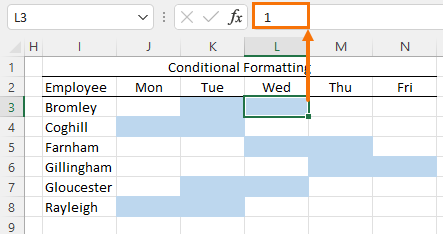
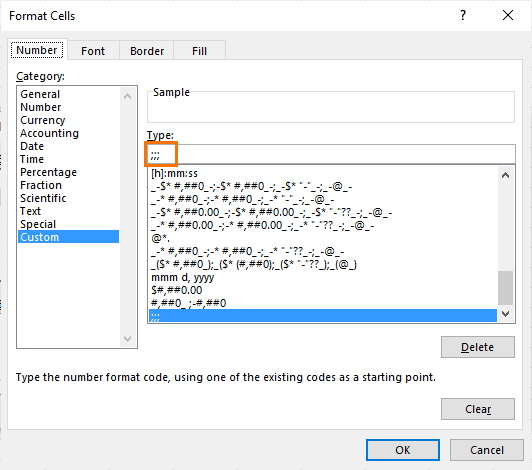
I’ve used custom number formats in the conditional formatting rule to hide the numbers on the face of the cell:
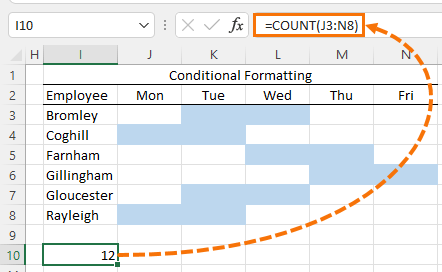
You can still reference the numbers to calculate the count:
7. Formatting Colours
There’s no need to use garish colours to highlight data:
Instead of bringing attention to the data, it makes your reader uncomfortable and the information difficult to read.
Solution: keep it simple and use complementary colours:
8. Multiple Records in One Cell
It can be tempting to shove as much data in a single cell as possible, but it’s difficult to then analyse that data with formulas.
Taking the example below, you might want to know how many people are listed for Wednesday:
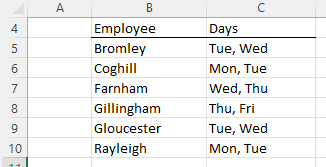
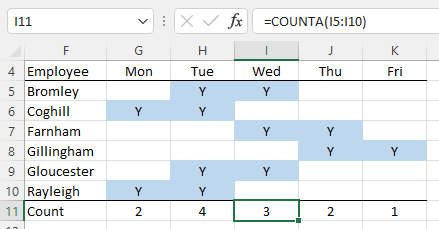
With the above layout, it’s very difficult do anything but count by eye. Whereas a layout with separate cells for each day, you can easily add a formula to count the number per day:
Note: the above layout is the final 'report' view. Ideally you will store your data in a tabular format as per point 2, then use a PivotTable or formulas to generate the report view above.
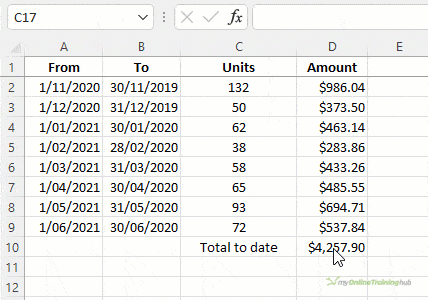
9. Sum Ranges Omitting Cells
Adding new rows of data above a SUM formula can sometimes result in the new row being omitted from the SUM.
To be fair, this was more of a problem in earlier versions of Excel, however it does still happen in Microsoft 365, as you can see in the example below:
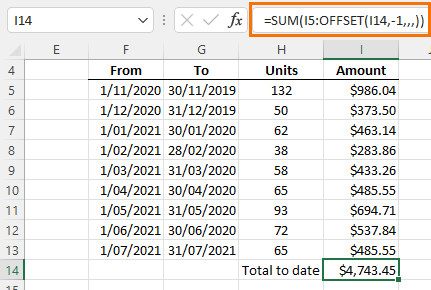
Solution: Use OFFSET to return the last cell reference in the range:
10. Using .xls File Type
The .xls file type was replaced with .xlsx from Excel 2007 onward, however many third party systems still have an option to export data to .xls.
.xls files are based on the Binary Interchange File Format (BIFF) and store information in binary format. Whereas .xslx files are based on Office Open XML format that stores data in compressed XML files in ZIP format. The underlying structure and files can be examined by simply unzipping the .xlsx file.
Solution: make a copy of the file and save it as a .xlsx file type.

jim again, with another tale of woe
the text entry for a job extends over several standard cell widths, so we shade the first cell orange or green to denote whether it’s been allocated yet, then “all the others” get shaded green when it’s been accepted
sorry, just had to vent!
Vent away, Jim!
and it’s OK, because the cell width is fixed, isn’t it?
also, some of the text within a cell is made bold or put in a different colour, or even capitalised to signify different things like rate to be paid, contractor, type of vehicle – that way you can get it all in one column (if you used another column, then you wouldn’t be able to see the text spilling across from the previous cell)
just when you think you’ve seen it all
thank goodness they haven’t discovered cell-merging!
they won’t know themselves once you’ve shown them some tips and tricks.
My final result actually looks more like a multi-colored waffle chart .
https://www.myonlinetraininghub.com/excel-waffle-charts-with-conditional-formatting
I did one project a few years back where vehicle status (downtime etc) were tracked on a daily basis. It involves hundreds of vehicles. Management require that the monthly dashboard must be color coded.
What I did was to convert their text status to numeric codes (via VLOOKUP) and then use a Pivot Table with conditional formatting to achieve the required results.
Days (1 – 30) in the Columns area, vehicle registration numbers in the Rows area and Status number in the Values area. The color coding actually allows management to spot issues at a glance very easily (although the final result looks like a colored Rubik cube ) The technique is similar to your number 6 mistake.
Nice! Thanks for sharing, Sunny 🙂
I would now also like to add:
long-winded formulae (extending to several lines on a wide screen),
– involving many layers of nested IFs, IFERRORs, VLOOKUPs to whole columns, INDIRECTs and other volatiles, and links to long-gone documents
– which have similar versions over the next few dozen columns that don’t use helper columns for repeated sections
– that are then copied down the next 50,000 columns – just in case (and because the file wasn’t big or slow enough)
it’s been a long day
🙂
I have a few to add:
over-use of conditional formatting (including doing every cell in a range individually or applying to whole rows and columns)
merging cells (over columns as well as rows)
whole-column VLOOKUP formulae
zooming out the sheet to 65% to see more, then increasing the font size to make it readable
merging cells
summing many individual cell refs when SUBTOTAL or SUMIF could be used
CONCATENATE
scrolling down thousands of rows to get to the end of a range or sheet (it’s just so painful to watch, I get twitchy)
merging cells
not using Tables (why do some people have such an aversion to using them?)
adding a new sheet to an already bloated spreadsheet when a new month starts
alternatively, adding a new COLUMN to a sheet every day for the past few years (with a weekly summary column)
adding extra blank columns as spacers
not being consistent
clinging on to various older versions of Excel (my 1st interview question is usually what version do you use? – I can still use 2003, and earlier, but it’s painful)
writing (uncommented) vb code to cope with many of the above and expecting it to always work
and did I mention cell-merging? – save it for the final report if you really must (even then, just don’t)
“but we’ve always done it this way”
jim
Nice list, Jim! I particularly liked “zooming out the sheet to 65% to see more, then increasing the font size to make it readable”!
yes, it seems to be a standard Finance trick (I’ve even put the “zoom to 100%” button on my QAT – I took the zoom slider off my status bar as I kept clicking it instead of horizontal scroll)
sorry about the rant, but that does feel better!
Rants welcome 🙂
I have been railing at coworkers for years! My #1 rule in Excel is NEVER merge cells, #2 Never EVER merge cells and #3 if you MUST merge cells, go use word because you’re not spread sheeting.
I was so irritated at MS for putting Merge Cells on the ribbon – why not just put Center Across Selection!
😀 glad we’re on the same page, Carsto! Please share the video with your co-workers.
This is a very good topic and contents. Thanks for the list!
May I add one to the list –
Never add leading spaces for the effect of indentation. Use the indentation properly!
Indeed we should always try to avoid unnecessary spaces. I am sure you know what i mean
Good one, MF! I’ve never seen someone do that before, but I’m not surprised 🙂
Wonderful list, many I too have seen with our users, especially the merging of cells for headers, the non-tabular data – sometimes data is being export from a system then they need it analysed but cannot due to it’s layout. Gaulish highlighting of data manually that means something just to them and the whole row/column and they wonder why the file is so large.
I learnt something new the sum OFFSET trick, that I will use now a lot more often than taking the lazy way out.
I am sure others have other Do Not’s as well – I hate no data validation being built in to worksheets and then have to analyse the data entered and you find multiple ways to spell the same item, once we had to go through amend many, many records where the person entering a comment would put the client’s name in the sentence rather than using the word client, but the rest of the sentence was basically the same – so Do Not leave out data validation.
Do not forget to format all your data consistently and correctly.
I wonder what others may come up with.
Great additions, Andrew! Thanks for sharing 🙂
Brilliant!
Glad you liked it, Simon!
This is some of the most helpful instruction on the basics of Excel use I’ve read. Every user should know these.Thanks, Mynda, for pointing the things out.
Thanks so much, William!