A data analyst gathers, cleans, models, analyses, and interprets data.
The gathering and cleaning should be done with Power Query. The modelling and analysis can be done with a combination of PivotTables/Power Pivot and functions.
The other day I stumbled upon a post claiming to list the top Excel functions for data analysts.
I disagreed with half the functions listed in that post, so I did a search and found a load more posts with pretty much the same list (they probably copied each other).
I’m going to try and right that wrong in this post by listing what I know are the top functions for data analysts and the functions that you don’t need to worry about learning so much.
Watch the Excel Functions for Data Analysts Video

Download Excel Functions for Data Analysts Workbook and Cheat Sheet

Enter your email address below to download the sample workbook and cheat sheet.

- Download the Cheat Sheet.
- Download the Excel Workbook and follow along. Note: This is a .xlsx file please ensure your browser doesn't change the file extension on download.
Excel Functions for Data Analysts
Function 1: IF, Nested IFs and IFS
The IF functions belong to the logic group of functions and are a must for every Excel user to know.
Get started with the IF function and nested IFs. And if you have Excel 2019 or later, or Microsoft 365, check out the newer IFS function.
Function 2: IF(AND and IF(OR
The AND and OR functions extend the number and type of logical tests you can specify when nested in the IF function. A lot of people struggle with them, but once you master these functions you won’t look back.
Still stuck? Download our IF formula builder and have your IF formulas written for you.
Function 3: SUMIFS
The SUMIFS function is one of the ‘IFS’ family of functions which enables you to aggregate data that matches criteria you specify. Once you know one of these functions, the others are easy because they all have the same syntax, with the exception of COUNTIF which doesn't require a sum_range since it's only counting results, as you can see below:
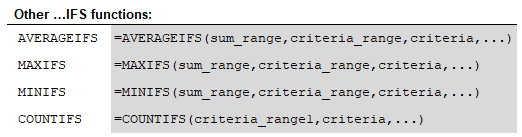
These functions treat all criteria as AND criteria, meaning each condition must be TRUE for the value to be included in the SUM/AVERAGE etc. If you need more flexibility, the SUMPRODUCT function can handle AND and OR criteria.
Function 4: XLOOKUP (or VLOOKUP)
The XLOOKUP function, available in Excel 2021 onward and Microsoft 365, is the new improved version of the much loved and sometimes hated VLOOKUP function. XLOOKUP gets around the limitations of VLOOKUP and removes the risk of inexperienced users inadvertently building formula errors into their work.
Function 5: INDEX & MATCH
INDEX and MATCH formulas can be scary for many users, but they get around the limitations of VLOOKUP. If you don’t have the XLOOKUP function in your version of Excel, then I encourage you to master INDEX & MATCH.
I’ll also go as far to say that the INDEX function is probably the MOST IMPORTANT EXCEL FUNCTION! If you’re already familiar with INDEX, then check out this tutorial that covers 5 things most people don’t know about the INDEX function:
Function 6: FILTER
The FILTER function is new in Excel 2021 and Microsoft 365. It’s one of the most important new functions we have in Excel. FILTER enables you to extract rows from a table of data based on criteria you specify. Not only that, you can extract some of the columns or all, or even extract the columns in a different order.
Function 7: IFERROR
The IFERROR function is a must for all report builders as it automatically hides errors returned by formulas ensuring a polished finish.
Function 8: EOMONTH and EDATE
The majority of Excel users work with date and time at some stage, especially accountants. The EOMONTH function, short for End of Month, and the EDATE Function, which I’m guessing is short for Extend Date, are super handy.
EOMONTH returns the last day of the month, n months before or after the specified date. It can even return the start of the month with a simple trick.
EDATE returns the same date of the month, n months before or after the specified date.
If you’d like to learn more about working with dates and times in Excel, check out my Excel Date & Time 101 and grab a copy of my eBook and examples file.
Function 9: NETWORKDAYS.INTL
As a data analyst you’ll typically be working with dates a lot. The NETWORKDAYS.INTL function returns the number of working days between two dates, excluding weekends and holidays.
Function 10: GETPIVOTDATA
The GETPIVOTDATA function is often misunderstood and harshly judged, but it’s the secret weapon of PivotTable users who want to create a custom styled report without the bulk of a PivotTable and is super robust.
Function 11: UNIQUE
The UNIQUE function generates a list of distinct items from an array, or a list of items that only occur once. It’s available in Excel 2021 onward, or with Microsoft 365.
It simplifies what once required super complex array formulas into a single easy function.
Function 12: SORT
The SORT function sorts the contents of a column, columns (range) or array in ascending or descending order. It's super handy for wrapping around functions that return lists like the UNIQUE function, or tables of data like the FILTER function. It’s available in Excel 2021 onward, or with Microsoft 365
Function 13: SEQUENCE
The SEQUENCE function returns a list of sequential numbers in an array. Among other things, it replaces the need to use the ROW or COLUMN function to return an array of values for use in other functions. It’s available in Excel 2021 onward and Microsoft 365.
More Excel Functions
Now that you’ve mastered the above functions, you can find more resources here:
Advanced Excel Formulas course – get up to speed with advanced formulas in 5 hours.
Excel Function Library – Looking for help on a specific Function? Check out our Excel Function Library.
Absolute References Explained – Absolute references are a cornerstone of writing formulas and are therefore a must have skill for every Excel user.
Absolute References for Tables – Tables have their own absolute reference language which is not as obvious as it should be.
Writing Formulas Efficiently – In this post I share how to write formulas in such as way that it’s quick to write, and quick to maintain.
Named Ranges – Unlock some more advanced techniques with named ranges and make your formulas easier to read, write and maintain.
Time Calculations – Working with dates and time in Excel is tricky if you don’t know the fundamentals of how Excel handles date-time values.
Excel Forum – Have a specific question you need help with? Our forum volunteers are eager to help you.
Functions You Don't Need
Below are some of the functions that appear in lists of ‘top Excel functions for data analysts’ which I don’t think are important, or there are better tools for the tasks they perform:
TRIM – removes all spaces from a text string except those between words. Data cleaning is a fundamental part of data analysis. The savvy data analyst will be using Power Query to automate these laborious repetitive tasks. They won’t be using functions like TRIM.
LEN – calculates the number of characters in a cell. This is often used when cleaning data to find if there are non-printing characters in a cell or to validate that data in a column is a consistent length. Why waste time with this when Power Query can automate these tasks.
DAYS – calculates the number of days between two dates, however this function is redundant. You can simply subtract one cell containing a date from another to calculate the number of days between two dates. E.g. =DAYS(B3,B2) is the same as =B3-B2
CONCATENATE or CONCAT – joins text together form multiple cells. You can do this with the ampersand character e.g. =CONCAT(A1,A2,A3) is the same as =A1&A2&A3. Other options are Flash Fill or you can automate this in Power Query.
ISBLANK – checks if the cell is empty. This is also often used to validate data quality and can be done more efficiently in Power Query.
As previously mentioned, Power Query is an essential tool for data analysts and as important as mastering functions. If you’d like to get your skills up to speed quickly, check out the video below and please consider taking my Power Query course.

There’s also the more powerful TEXTJOIN, a tool that widens the capabilities of CONCATENATE/CONCAT.
Nice addition, Abbott. Thanks for sharing
Small correction: Function 3, Countifs does not take a sum range, it goes straight to criteria.
Yes, good pickup, Bryant. Thanks so much. All fixed now.
Quick note of sincere thanks for all the great work you do! THANKS MUCH!
Thanks so much, Merrill!
I do a lot more DAX coding today than I once did, but I’m not sure I agree with some of the functions listed as “most useful”. I’ve yet to use Index and Match in the entirety of my career; particularly since if something like this is truly needed, it’s more intuitive to me to write a nested VLOOKUP/HLOOKUP, or more simply, use the aggregator functions like SUMIFS.
Although DAX is much better at this, AGGREGATE is very useful when Power Pivot doesn’t make sense.
If you’re looking up a text result, then the aggregator functions won’t work. There is a lot more to INDEX than just returning a value (which is all V/HLOOKUP can do). See my video: 5 Excel INDEX Function Secrets. Once you’ve mastered INDEX, it opens a world of possibilities. Some have said that it’s THE most powerful/useful function in Excel!