• Skip to main content
  • Skip to header right navigation
  • Skip to site footer

My Online Training Hub

Learn Dashboards, Excel, Power BI, Power Query, Power Pivot

  • Courses
  • Pricing
    • Free Courses
    • Power BI Course
    • Excel Power Query Course
    • Power Pivot and DAX Course
    • Excel Dashboard Course
    • Excel PivotTable Course – Quick Start
    • Advanced Excel Formulas Course
    • Excel Expert Advanced Excel Training
    • Excel Tables Course
    • Excel, Word, Outlook
    • Financial Modelling Course
    • Excel PivotTable Course
    • Excel for Customer Service Professionals
    • Multi-User Pricing
  • Resources
    • Free Downloads
    • Excel Functions Explained
    • Excel Formulas
    • Excel Add-ins
    • IF Function
      • Excel IF Statement Explained
      • Excel IF AND OR Functions
      • IF Formula Builder
    • Time & Dates in Excel
      • Excel Date & Time
      • Calculating Time in Excel
      • Excel Time Calculation Tricks
      • Excel Date and Time Formatting
    • Excel Keyboard Shortcuts
    • Excel Custom Number Format Guide
    • Pivot Tables Guide
    • VLOOKUP Guide
    • ALT Codes
    • Excel VBA & Macros
    • Excel User Forms
    • VBA String Functions
  • Members
    • Login
  • Blog
  • Excel Webinars
  • Excel Forum
    • Register as Forum Member

Create a Pivot Table Direct From Access

You are here: Home / Excel Charts / Create a Pivot Table Direct From Access
Create a Pivot Table Direct From Access
August 17, 2011 by Mynda Treacy

Did you know you can analyse data from an Access database in an Excel Pivot Table without importing the data first?

Excel Pivot Table from Access Database

If you use Access then this is a great productivity booster because once you connect to your Access query you simply refresh the data connection and your Pivot Table updates, as do any charts or reports you have connected to the Pivot Table data.

Excel Pivot Table from Access queryAlmost all Access databases consist of more than one table, so if yours is like this then you need to build a query in Access that brings together all the data you want to analyse in your Pivot Table.

Then you simply insert a Pivot Table and select the 'Use an external data source' option and click the ‘Choose Connection’ button.

Excel Pivot Table from external data

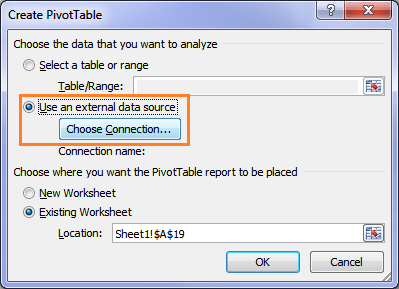
You can then browse to your existing connection:

Excel Pivot Table from Access Database Connection

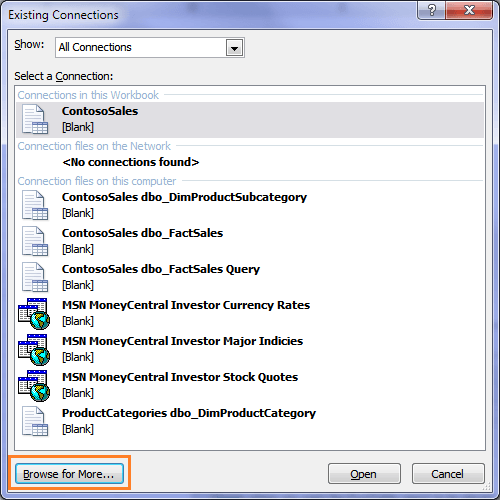
Once you have selected your file you can select the query you want to connect to:

Excel Pivot Table from Access Database query

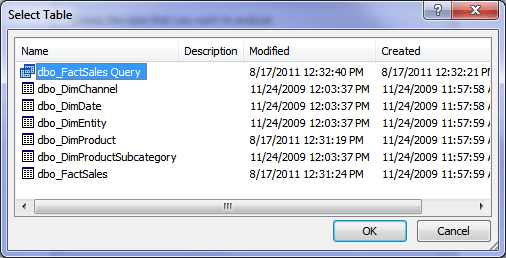
Note: Remember, if your Access database has more than one table in it you will need to build a query first and then connect your Pivot Table to the query.

Tip: Since Excel imports the data in the query into the Pivot Cache it is recommended that you only include data in the query that you need, as unnecessary data will generate a large, slow file.

Once you click OK it may take a while for Excel to import all of the data into the Pivot Cache. If your Access query is large then this may take a few minutes, depending on the processing power of your PC and the location of the database.

Now you can Pivot away to your heart’s content…

Excel Pivot Table from Access query

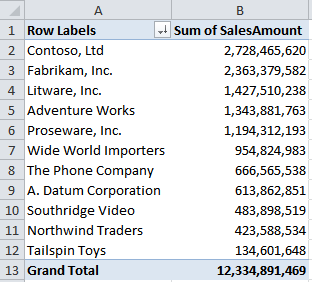
and while you’re there you can add a PivotChart or other reports from the data.

Excel Pivot Chart from Access query

Then each week/month/quarter simply refresh the Pivot Table (CTRL+ALT+F5) to update your reports.

Refreshing your Pivot Table using CTRL+ALT+F5 automatically connects to Access and brings in the new data. Job done 🙂

It's probably not even time for morning tea yet, but I'm sure your boss won't mind if you take a break since you've got your work done in record time.

Tip: Importing data into Excel isn't limited to Access. You can import data from the web, SQL Servers and other sources you may have access to.

The ability to connect directly to external data sources and analyse them with Pivot Tables eliminates the tedious tasks associated with importing data like copy, paste, formatting and complex formulas, not to mention the ongoing maintenance of this data as it grows monthlty and requires updating.

Get over 10 hours of comprehensive Excel online training, including tutorials on Excel Pivot Tables and Importing External Data into Excel.

Create a Pivot Table Direct From Access

More Database Posts

Easy Excel Database Functions

Easy Excel Database Functions

Excel database functions are more powerful than their SUMIFS, COUNTIFS etc. equivalents allowing both AND and OR critiera!
Importing Data into Excel

Importing Data into Excel

More Pivot Table Posts

Excel Pivot Tables Year on Year Change

How to calculate Year on Year variances in Pivot Tables
Sorting in Excel PivotTables

Sorting in Excel PivotTables

Excel PivotTables Unique Count 3 Ways

Excel PivotTables Unique Count 3 Ways

Excel PivotTables Unique Count, or distinct count as it's also know, is easy, but there are different approaches depending on your version of Excel.
Excel Factor 6 Auto Refresh PivotTables

Excel Factor 6 Auto Refresh PivotTables

Excel Factor Entry 1 - Reverse PivotTable

Excel Factor Entry 1 – Reverse PivotTable

More Excel Charts Posts

excel speedometer charts

Excel Speedometer Charts

How to build Excel Speedometer Charts or Gauge Charts as they're also know, why they are BAD and what to use instead.
burn up burn down charts

Excel Project Management Burn Down and Burn Up Charts

Excel Burn Down and Burn Up Charts are easy to make with line or scatter charts. They are useful for monitoring the progress of a project.
wee people font charts

Excel WeePeople Font Charts

Excel WeePeople Font Charts are a nice change from generic shapes for waffle charts, bar/column charts and more.
excel dot map charts

Excel Dot Map Charts

Interactive Excel dot map charts are not built-in, but with some creative use of Excel’s built-in tools we can create something unique.
Excel S Curve Charts

Excel S-Curve Charts

Easy Excel S-curve Charts made with PivotTables for project management. Track progress by including budget amounts.
chart axis switch

Excel Chart Axis Switch

Use radio button form controls to create an Excel chart axis switch enabling you to toggle pannel charts between same axis and own axis.

Excel Charts with Shapes for Infographics

Excel Charts with Shapes for Infographic styling and increased interest in your charts. Easy to insert but there are a few tricks required.
excel pyramid chart

Excel Pyramid Charts

Excel Pyramid charts are useful for visualising demographic data across multiple categories. Let’s look at 3 ways we can build them in Excel.

Highlighting Periods in Excel Charts

Highlighting Periods in Excel Charts helps your users interpret them more quickly and or focus their attention on a point or area.
stacked bar waffle chart

Stacked Bar Excel Waffle Charts

Stacked Bar Excel Waffle Charts are an alternate to using conditional formatting to build waffle charts, and some say they're easier.
Category: Excel ChartsTag: Database, pivot table
Previous Post:Excel Chart Axis Label TricksExcel Chart Axis Label Tricks
Next Post:Excel SEARCH and You Will FINDExcel SEARCH and You Will FIND

Reader Interactions

Comments

  1. Christine Brotz

    October 16, 2015 at 7:15 am

    This is so wonderful! 2 million record file – could not open in Excel – just linked to Access! Very cool.

    L.E.: That would be cool. 🙂

    Reply
    • Mynda Treacy

      October 16, 2015 at 2:43 pm

      Fantastic, Christine! Glad I could help.

      Reply
  2. JEEVAN

    October 19, 2013 at 6:24 am

    I have a question on MS access.
    I am given a task to use a expediting report (materials from procurement) on which I need to summaries the data based on the materials & qty and vendor & qty (25000 rows).
    First I used excel pivot to summaries the data, where I dropped on the column field by “design area” and row field “material code” and qty as values. tht is fine, I wanted to include two new row fields “condition1 & Condition2” which should be repeated for each “material code” I dropped in row field previously. problem is these 2 conditions (1 & 2 ) sometimes is present in the source data or sometimes anyone condition is present (either 1 or 2). But I want both condition to be repeated for all material code in pivot table and leave a blank row if values are not there?
    I am using access also to solve this problem w/o too much manual effort. I am not able to solve it. Can you please help!

    Reply
    • Mynda Treacy

      October 19, 2013 at 10:12 pm

      Hi Jeevan,

      Have you tried to check the ‘Show items with no data’ on the Layout and Print tab in the Field settings?

      Right click the PivotTable > Field Settings > Layout & Print tab.

      I hope that helps.

      Kind regards,

      Mynda.

      Reply
  3. Chuck Litecky

    May 22, 2013 at 5:56 am

    It looks like part of your Access database is the same as that on a MS website with a Pivot Table tutorial. Is this data copyrighted or are there any limitations on its use?

    Reply
    • Mynda Treacy

      May 22, 2013 at 2:16 pm

      Hi Chuck,

      I’m sure there are limitations on its use, however it’s there to aid in learning so I would ‘think’ if it’s being used for that purpose then it’s not in breach….or if it is it’s not in Microsoft’s interest to do anything about it.

      Cheers,

      Mynda.

      Reply
  4. James

    April 26, 2013 at 10:40 am

    Hi
    I used this method however it wont display all of the available queries. I have 18 queries in my DB but excel will only show me 6?
    any ideas?
    Thanks

    Reply
    • Mynda Treacy

      April 27, 2013 at 9:01 pm

      Hmmm…not sure why it would be doing this, James. Sorry.

      Reply
  5. Heather

    March 2, 2013 at 6:06 am

    Is there a way for the excel pivot table to pick up the query caption names versus the field names?

    Reply
    • Mynda Treacy

      March 3, 2013 at 8:06 pm

      Hi Heather,

      Not that I can find, unfortunately 🙁

      Kind regards,

      Mynda.

      Reply
  6. Nitu

    December 6, 2012 at 10:31 pm

    I want to export multiple queries through one connection. Any idea how to go about this?

    Reply
    • Mynda Treacy

      December 7, 2012 at 10:12 am

      Hi Nitu,

      Have you tried embedding the queries you want on the relevant worksheets in Excel and then simply refreshing them when you need?

      To create a link to your Access database from within Excel on the Data menu choose From Access. Once the queries are set up, you can refresh all by clicking CTRL+ALT+F5 or click the Refresh All button on the Data tab of the Ribbon.

      Kind regards,

      Mynda.

      Reply
  7. Kelly R

    October 16, 2012 at 4:33 am

    I connected Excel pivot tables to my Access database as described above and everything worked great. However, when I made a change to the field order in the linked query, the pivot refresh did not work properly. The refresh finished, but the data was in the wrong columns. For example, if before my query consisted of FirstName, LastName, MiddleName, and I changed the query to be First/Middle/Last, the refresh did not update the Field List Order and resulted with last names in the MiddleName column and middle names in the LastName column.

    Is there a way to force the Field List order to refresh in addition to the data?

    Thanks!

    Reply
    • Mynda Treacy

      October 16, 2012 at 1:51 pm

      Hi Kelly,

      I tested it with my Access database and PivotTable and it refreshed correctly. Maybe something was corrupted with yours. Have you tried to rebuild the query?

      Kind regards,

      Mynda.

      Reply

Leave a Reply Cancel reply

Your email address will not be published. Required fields are marked *

Current ye@r *

Leave this field empty

Sidebar

More results...

Shopping Cart

mynda treacy microsoft mvpHi, I'm Mynda Treacy and I run MOTH with my husband, Phil. Through our blog, webinars, YouTube channel and courses we hope we can help you learn Excel, Power Pivot and DAX, Power Query, Power BI, and Excel Dashboards.

Subscribe to Our Newsletter

Receive weekly tutorials on Excel, Power Query, Power Pivot, Power BI and More.

We respect your email privacy

Guides and Resources

  • Excel Keyboard Shortcuts
  • Excel Functions
  • Excel Formulas
  • Excel Custom Number Formatting
  • ALT Codes
  • Pivot Tables
  • VLOOKUP
  • VBA
  • Excel Userforms
  • Free Downloads

239 Excel Keyboard Shortcuts

Download Free PDF

Free Webinars

Excel Dashboards Webinar

Watch our free webinars and learn to create Interactive Dashboard Reports in Excel or Power BI

Click Here to Watch Now
  • Excel
  • Excel Charts
  • Excel Dashboard
  • Excel Formulas
  • Excel PivotTables
  • Excel Shortcuts
  • Excel VBA
  • General Tips
  • Online Training
  • Outlook
  • Power Apps
  • Power Automate
  • Power BI
  • Power Pivot
  • Power Query
 
  • About My Online Training Hub
  • Contact
  • Disclosure Statement
  • Frequently Asked Questions
  • Guarantee
  • Privacy Policy
  • Terms & Conditions
  • Testimonials
  • Become an Affiliate

Copyright © 2023 · My Online Training Hub · All Rights Reserved

Microsoft and the Microsoft Office logo are trademarks or registered trademarks of Microsoft Corporation in the United States and/or other countries. Product names, logos, brands, and other trademarks featured or referred to within this website are the property of their respective trademark holders.

Download A Free Copy of 100 Excel Tips & Tricks

excel tips and tricks ebook

We respect your privacy. We won’t spam you.

x