• Skip to main content
  • Skip to header right navigation
  • Skip to site footer

My Online Training Hub

Learn Dashboards, Excel, Power BI, Power Query, Power Pivot

  • Courses
  • Pricing
    • SALE 20% Off All Courses
    • Free Courses
    • Power BI Course
    • Excel Power Query Course
    • Power Pivot and DAX Course
    • Excel Dashboard Course
    • Excel PivotTable Course – Quick Start
    • Advanced Excel Formulas Course
    • Excel Expert Advanced Excel Training
    • Excel Tables Course
    • Excel, Word, Outlook
    • Financial Modelling Course
    • Excel PivotTable Course
    • Excel for Customer Service Professionals
    • Multi-User Pricing
  • Resources
    • Free Downloads
    • Excel Functions Explained
    • Excel Formulas
    • Excel Add-ins
    • IF Function
      • Excel IF Statement Explained
      • Excel IF AND OR Functions
      • IF Formula Builder
    • Time & Dates in Excel
      • Excel Date & Time
      • Calculating Time in Excel
      • Excel Time Calculation Tricks
      • Excel Date and Time Formatting
    • Excel Keyboard Shortcuts
    • Excel Custom Number Format Guide
    • Pivot Tables Guide
    • VLOOKUP Guide
    • ALT Codes
    • Excel VBA & Macros
    • Excel User Forms
    • VBA String Functions
  • Members
    • Login
    • Logout
    • Password Reset
  • Blog
  • Excel Webinars
  • Excel Forum
    • Register as Forum Member

Excel Chart Axis Label Tricks

You are here: Home / Excel Charts / Excel Chart Axis Label Tricks
Excel Chart Axis Label Tricks
August 10, 2011 by Mynda Treacy

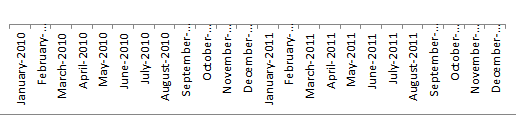
So, you’ve analysed your data and plotted your chart but the axis labels are all skewey (technical term).

Bad Excel Chart Axis Labels

Let’s look at our options to make this better:

Chart Axis Alignment

We could use the alignment tools. Right-click axis > Format Axis > Alignment.

But before you waste time doing this there is a better way. Actually there are a few options.

First, you don’t want your audience having to turn their head to the side to read labels. If you’re plotting dates then you can:

Chart Axis Labels Option 1 - Abbreviate

Better Excel Chart Axis Labels

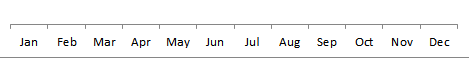
This is fine if you’re only plotting one year, but if you want to plot more than that then you start to get the skewey effect again.

Chart Axis Labels Option 2 - Nested Axis Labels

Best Excel Chart Axis Labels

Data for nested Excel Chart Axis Labels
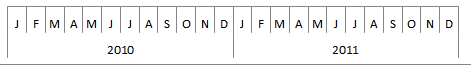
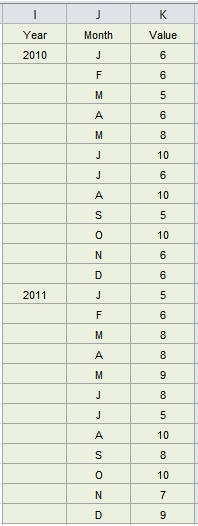
Now, doesn’t that look better? To create this effect you simply need to house your year labels in a separate column to your month labels, like this:

Excel is clever enough to know that the year and month columns are your axis labels and it automatically nests them for you.

Now, while this is fine for year and month labels that are easily interpreted in an abbreviated form, what if you’ve got labels like products or regions that need the full label displayed? Read on for the solution.


Chart Axis Labels Option 3 - Bar Charts

The best solution is to use a bar chart which plots the columns horizontally like this:

Excel Bar Chart

Note: The Bar Chart is only available in Excel 2007 and Excel 2010.

‘But I’ve got Excel 2003’ you say!

If you’re unfortunate enough to still have Excel 2003 then you can insert a column chart and use Excel’s Camera tool to take an image of your chart, and then use the handles to turn it on its side.

There are limitations to the Camera Tool though. You can read more about it in my Excel Camera Tool Tutorial.

Another alternative is In-cell charts, but that’s a lesson for another day.

Enter your email address below to download the sample workbook.


By submitting your email address you agree that we can email you our Excel newsletter.
Please enter a valid email address.

Download the workbook and copy these tricks. Note: This is a .xlsx file. Please ensure your browser doesn't change the file extension on download.

If you’d like to learn more cool chart tricks keep an eye out for my upcoming Dashboard Training Course.

If you liked this be sure to click the Facebook button below, or Tweet it to share the knowledge.

Excel Chart Axis Label Tricks

More Excel Charts Posts

excel speedometer charts

Excel Speedometer Charts

How to build Excel Speedometer Charts or Gauge Charts as they're also know, why they are BAD and what to use instead.
burn up burn down charts

Excel Project Management Burn Down and Burn Up Charts

Excel Burn Down and Burn Up Charts are easy to make with line or scatter charts. They are useful for monitoring the progress of a project.
wee people font charts

Excel WeePeople Font Charts

Excel WeePeople Font Charts are a nice change from generic shapes for waffle charts, bar/column charts and more.
excel dot map charts

Excel Dot Map Charts

Interactive Excel dot map charts are not built-in, but with some creative use of Excel’s built-in tools we can create something unique.
Excel S Curve Charts

Excel S-Curve Charts

Easy Excel S-curve Charts made with PivotTables for project management. Track progress by including budget amounts.
chart axis switch

Excel Chart Axis Switch

Use radio button form controls to create an Excel chart axis switch enabling you to toggle pannel charts between same axis and own axis.

Excel Charts with Shapes for Infographics

Excel Charts with Shapes for Infographic styling and increased interest in your charts. Easy to insert but there are a few tricks required.
excel pyramid chart

Excel Pyramid Charts

Excel Pyramid charts are useful for visualising demographic data across multiple categories. Let’s look at 3 ways we can build them in Excel.

Highlighting Periods in Excel Charts

Highlighting Periods in Excel Charts helps your users interpret them more quickly and or focus their attention on a point or area.
stacked bar waffle chart

Stacked Bar Excel Waffle Charts

Stacked Bar Excel Waffle Charts are an alternate to using conditional formatting to build waffle charts, and some say they're easier.


Category: Excel Charts
Previous Post:Excel Chart Secondary AxisExcel Chart Secondary Axis
Next Post:Create a Pivot Table Direct From AccessCreate a Pivot Table Direct From Access

Reader Interactions

Comments

  1. Sean

    January 18, 2016 at 10:09 am

    Hi Mynda

    I tried the above using Excel 2010 and for some reason my horizontal axis labels only bring back the month and not the year. My data source is looking at both month and year. Can you please help?
    Thanks
    Sean

    Reply
    • Mynda Treacy

      January 18, 2016 at 11:26 am

      Hi Sean,

      First check you have acutally referenced both the month and year columns in your axis source, then check the chart area is big enough to display the whole axis. Sometimes it’s just a case of making the chart bigger. If either of those options doesn’t solve it then please send the file to me via the Help Desk.

      Kind regards,

      Mynda

      Reply
  2. Tammy Beedie

    October 24, 2015 at 5:11 am

    It would not allow me to download the workbook. Could you tell me why?

    Reply
    • Mynda Treacy

      October 24, 2015 at 8:11 am

      Hi Tammy,

      Please right-click > Save Link As (or equivalent for your browser) > make sure the file extension is .xlsx

      Once downloaded navigate to the folder you saved the file in and open it like any other Excel file.

      I hope that helps but please let us know if you’re still having problems.

      Mynda

      Reply
  3. Kazoo Kate

    April 16, 2013 at 2:56 am

    I HAD Excel 2003, where I successfully had THREE levels of nested x-axis labels for a column chart. Now, in Excel 2010, only the first level shows!! I cannot find any solution on the web. Do you have one??

    Reply
    • Mynda Treacy

      April 16, 2013 at 8:13 pm

      Hi Kazoo,

      The process is the same as the 2 level axis above (see Option 2), except you add a third column to your axis label data.

      I hope that helps.

      Kind regards,

      Mynda.

      Reply
  4. Doug

    March 29, 2012 at 1:07 am

    The “Download the workbook and copy these tricks” link downloads a .zip file with bunch of XML files andno instructions on how to use them to get the sample workbook.

    Reply
    • Mynda Treacy

      March 30, 2012 at 6:10 am

      Hi Doug,

      The workbook is not zipped. It’s a .xlsx file. If you hover your mouse over the link you can see the file name ends in a .xlsx extension (usually in the bottom right or left of your browser window).

      Some browsers assume files are zipped and change the file extension when you try to download them. Just make sure the file extension is a .xlsx file when you download it. You can simply type over the .zip extension with .xlsx to fix the problem while in the ‘file save as’ or similar dialog box.

      I hope that makes sense. Let me know if not.

      Kind regards,

      Mynda.

      Reply

Leave a Reply Cancel reply

Your email address will not be published. Required fields are marked *

Current ye@r *

Leave this field empty

Sidebar

More results...

Course Sale

mynda treacy microsoft mvpHi, I'm Mynda Treacy and I run MOTH with my husband, Phil. Through our blog, webinars, YouTube channel and courses we hope we can help you learn Excel, Power Pivot and DAX, Power Query, Power BI, and Excel Dashboards.

Subscribe to Our Newsletter

Receive weekly tutorials on Excel, Power Query, Power Pivot, Power BI and More.

We respect your email privacy

Guides and Resources

  • Excel Keyboard Shortcuts
  • Excel Functions
  • Excel Formulas
  • Excel Custom Number Formatting
  • ALT Codes
  • Pivot Tables
  • VLOOKUP
  • VBA
  • Excel Userforms
  • Free Downloads

239 Excel Keyboard Shortcuts

Download Free PDF

Free Webinars

Excel Dashboards Webinar

Watch our free webinars and learn to create Interactive Dashboard Reports in Excel or Power BI

Click Here to Watch Now

Blog Categories

  • Excel
  • Excel Charts
  • Excel Dashboard
  • Excel Formulas
  • Excel PivotTables
  • Excel Shortcuts
  • Excel VBA
  • General Tips
  • Online Training
  • Outlook
  • Power Apps
  • Power Automate
  • Power BI
  • Power Pivot
  • Power Query
trustpilot excellent rating
 

Company

  • About My Online Training Hub
  • Disclosure Statement
  • Frequently Asked Questions
  • Guarantee
  • Privacy Policy
  • Terms & Conditions
  • Testimonials
  • Become an Affiliate

Support

  • Contact
  • Forum
  • Helpdesk – For Technical Issues

Copyright © 2023 · My Online Training Hub · All Rights Reserved

Microsoft and the Microsoft Office logo are trademarks or registered trademarks of Microsoft Corporation in the United States and/or other countries. Product names, logos, brands, and other trademarks featured or referred to within this website are the property of their respective trademark holders.