• Skip to main content
  • Skip to header right navigation
  • Skip to site footer

My Online Training Hub

Learn Dashboards, Excel, Power BI, Power Query, Power Pivot

  • Courses
  • Pricing
    • Free Courses
    • Power BI Course
    • Excel Power Query Course
    • Power Pivot and DAX Course
    • Excel Dashboard Course
    • Excel PivotTable Course – Quick Start
    • Advanced Excel Formulas Course
    • Excel Expert Advanced Excel Training
    • Excel Tables Course
    • Excel, Word, Outlook
    • Financial Modelling Course
    • Excel PivotTable Course
    • Excel for Customer Service Professionals
    • Excel for Operations Management Course
    • Excel for Decision Making Under Uncertainty Course
    • Excel for Finance Course
    • Excel Analysis ToolPak Course
    • Multi-User Pricing
  • Resources
    • Free Downloads
    • Excel Functions Explained
    • Excel Formulas
    • Excel Add-ins
    • IF Function
      • Excel IF Statement Explained
      • Excel IF AND OR Functions
      • IF Formula Builder
    • Time & Dates in Excel
      • Excel Date & Time
      • Calculating Time in Excel
      • Excel Time Calculation Tricks
      • Excel Date and Time Formatting
    • Excel Keyboard Shortcuts
    • Excel Custom Number Format Guide
    • Pivot Tables Guide
    • VLOOKUP Guide
    • ALT Codes
    • Excel VBA & Macros
    • Excel User Forms
    • VBA String Functions
  • Members
    • Login
    • Password Reset
  • Blog
  • Excel Webinars
  • Excel Forum
    • Register as Forum Member

World’s Most Accurate Pie Chart

You are here: Home / Excel Charts / World’s Most Accurate Pie Chart
Worlds Most Accurate Pie Chart
March 13, 2013 by Mynda Treacy

Excel Pie Charts

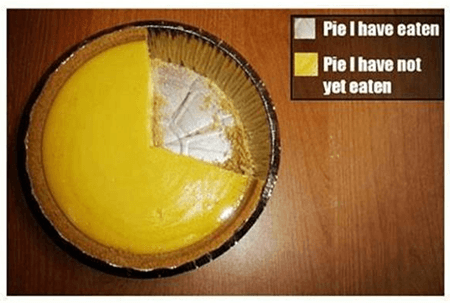
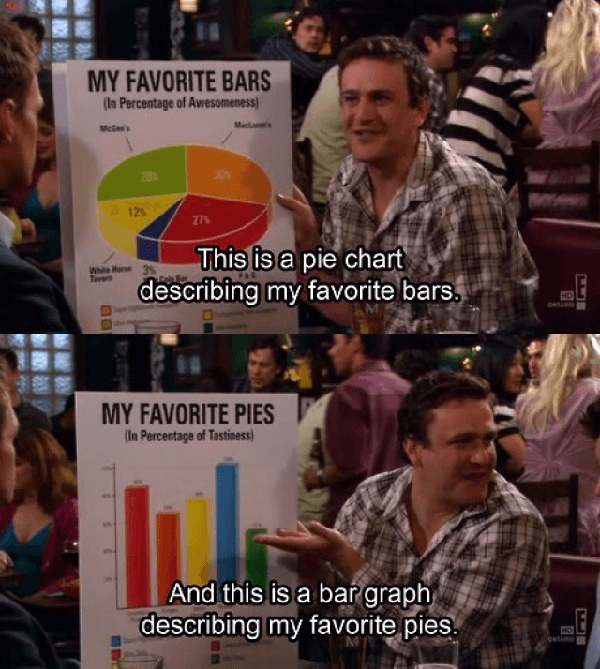
As fun as this chart is, it actually makes a valid point and that is; pie charts are (typically) not very useful.

Why?

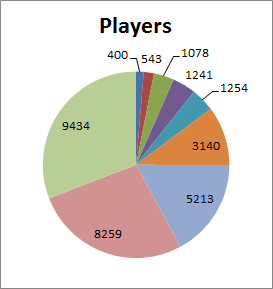
They’re slow to interpret because they usually have too many slices with teeny weeny labels on stalks.

You know the ones….like this:

Excel Pie Charts

Nine times out of ten there are better charts to display your data.

When Not to Pie

  1. If you need labels on sticky outy arms.
  2. If all of the slices are roughly the same size.
  3. If another chart can convey your message faster and, or more accurately.
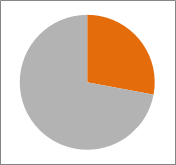
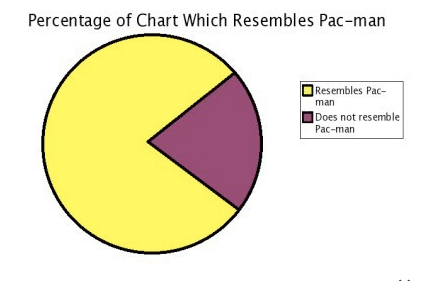
  4. If you have more than 2 slices. The bottom line is that a pie chart is really only useful if you're comparing one slice to a whole like this:

Excel Pie Charts

Still Sceptical? Let’s Do An Experiment

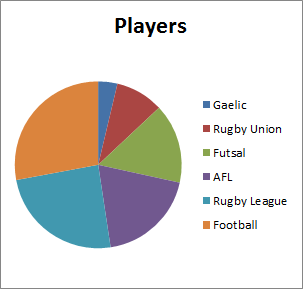
Answer the following questions about the pie chart below and time how long it takes you in total to figure them out.

Ok, ready? Start your time…..NOW:

  1. What sport has the most players?
  2. What sport has the second most players?
  3. What sport has the least players?

Excel Pie Charts

Ok, stop your time and make a note of how long it took you to answer those questions.

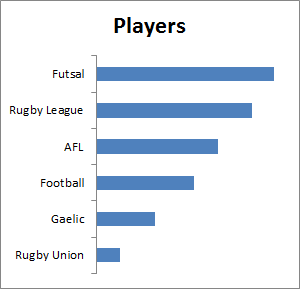
Next, answer the same questions for the bar chart below…..Tip: the answers are different to the Pie Chart ;).

Now, get ready to start your time again……Ready…Set….GO:

  1. What sport has the least players?
  2. What sport has the second most players?
  3. What sport has the most players?

Excel Pie Charts

Ok, write down how long it took you to answer the questions for this chart.

Which chart was faster? I’d put money on the bar chart.

I’d also expect the bar chart required less effort to interpret.

For example, in the bar chart you can easily see the list of sports, and in a split second you can see which is biggest/smallest etc. Whereas with the Pie chart you have to look back and forth between the orange and teal slices to work out which is bigger, and then map the slices to the legend.

The bar chart might be only a few seconds faster but the purpose of reporting is to convey your message in the quickest and easiest way for the reader. You won't be thanked for making them work harder than they need to.

Was it a Fair Test?

I thought you might ask, so to make this a fair test I did the following things for both charts:

  • The same values were used but assigned to different sports.
  • Values were sorted in descending order.
  • No labels or axis (axis also begins at zero so no artificial scaling).
  • Answers were different for both charts so that the bar chart didn't have an advantage of prior knowledge.

I know that in the real world you’d probably have labels on the pie chart and the bar chart would at least have an axis, but one of the purposes of this exercise was to show you how much information you can gather without labels or an axis.

Why? Because this is what our brain does in a split second anyway. We are interpreting the data before we’ve even had a chance to β€˜read’ any labels etc.

So, although the pie chart looks visually appealing with its nice array of colours, it actually isn’t helping convey the message.

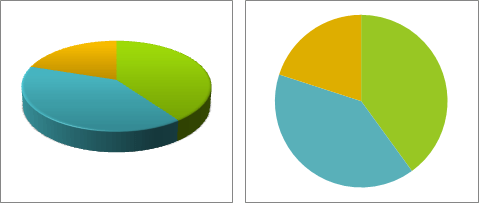
And don’t even get me started on 3D pie charts. Stay away from them like your life depends on it.

Why Pie Charts Fail

  1. The slices in a pie chart are difficult to compare and therefore transmit less information.
  2. 3D charts are even more difficult to compare and usually distort the results. Just take this example where the blue slice in the 3D chart looks biggest, but it's actually the same size as the green slice, as you can see from the regular pie chart on the right.
  3. Excel Pie Charts

  4. You can't convey change over time in a pie chart.... and no, two pie charts side by side won't do it either.
  5. Labelling pie charts is messy. Bar charts are cleaner as the labels can sit on the axis.

The Moral of This Story

Pies are for eating not charting.

Don’t get drawn in by the pie chart’s kaleidoscopic display. Do your audience a favour and give them a chart that's quick and easy to read.

Want More Chart Tips?

Check out my Excel Dashboard course and then take a look at http://junkcharts.typepad.com by Kaiser Fung who writes about his idea of the β€˜Trifecta Checkup’ framework for chart critique.

Answers

For completeness purposes.

Pie Chart

  1. Football
  2. Rugby League
  3. Gaelic

Bar Chart

As if you didn’t know already:
  1. Rugby Union
  2. Rugby League
  3. Futsal

So, What Are Pie Charts Good For?

A laugh! Here are a few I found. Enjoy!

Excel Pie Charts

Excel Pie Charts

Excel Pie Charts

Worlds Most Accurate Pie Chart

More Excel Pie Chart Posts

More Excel Charts Posts

picture fill excel charts

Picture Fill Excel Charts

Using a stylish picture fill in your Excel Charts is a simple way to make your data visualizations more captivating and memorable
excel speedometer charts

Excel Speedometer Charts

How to build Excel Speedometer Charts or Gauge Charts as they're also know, why they are BAD and what to use instead.
burn up burn down charts

Excel Project Management Burn Down and Burn Up Charts

Excel Burn Down and Burn Up Charts are easy to make with line or scatter charts. They are useful for monitoring the progress of a project.
wee people font charts

Excel WeePeople Font Charts

Excel WeePeople Font Charts are a nice change from generic shapes for waffle charts, bar/column charts and more.
excel dot map charts

Excel Dot Map Charts

Interactive Excel dot map charts are not built-in, but with some creative use of Excel’s built-in tools we can create something unique.
Excel S Curve Charts

Excel S-Curve Charts

Easy Excel S-curve Charts made with PivotTables for project management. Track progress by including budget amounts.
chart axis switch

Excel Chart Axis Switch

Use radio button form controls to create an Excel chart axis switch enabling you to toggle pannel charts between same axis and own axis.

Excel Charts with Shapes for Infographics

Excel Charts with Shapes for Infographic styling and increased interest in your charts. Easy to insert but there are a few tricks required.
excel pyramid chart

Excel Pyramid Charts

Excel Pyramid charts are useful for visualising demographic data across multiple categories. Let’s look at 3 ways we can build them in Excel.

Highlighting Periods in Excel Charts

Highlighting Periods in Excel Charts helps your users interpret them more quickly and or focus their attention on a point or area.


Category: Excel ChartsTag: excel pie chart
Previous Post:Excel Conditional Formatting with FormulasExcel Conditional Formatting with Formulas
Next Post:Excel PivotTable Add Percentage of Total Column [Video]Excel PivotTable Add Percentage of Total Column [Video]

Reader Interactions

Comments

  1. Osman Gulecyuz

    May 23, 2016 at 6:36 pm

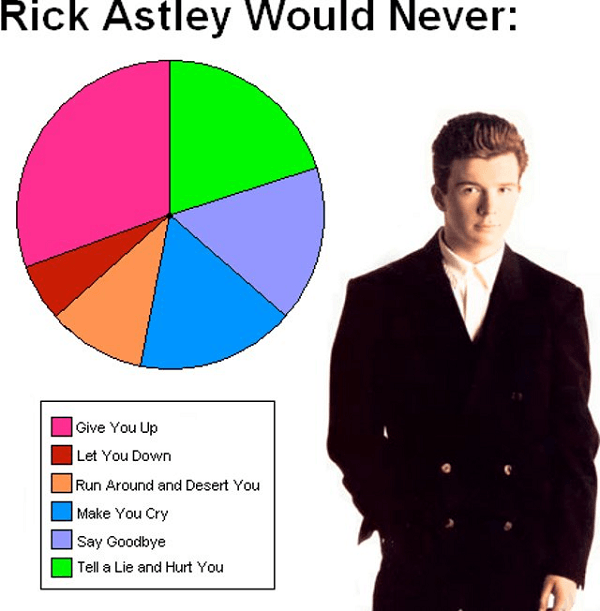
    that Rick Astley part made me laugh my ass off, thanks.

    Reply
    • Mynda Treacy

      May 23, 2016 at 7:46 pm

      πŸ™‚ glad you enjoyed it, too.

      Reply
  2. Michael

    May 20, 2016 at 7:32 am

    Great Mynda. Once the data team at work did a hilarious rendition of Gotye’s “Somebody that I used to know” song, making it about a pie chart that feels like it was cut off without an explanation. They replaced lines like the title with “some graphic that you used to do”, and “You can get addicted to a certain kind of graphic”.
    It changed my opinion of pie charts forever, but otherwise this post would have done that.

    Reply
    • Mynda Treacy

      May 20, 2016 at 9:51 pm

      Thanks, Michael.

      Sounds like your data team are a fun crowd πŸ™‚

      Reply
  3. Sandra Hodgson

    May 19, 2016 at 11:28 pm

    Point made! I thought pie charts were awesome, until this article, now I see the wisdom of your ways :).

    Reply
    • Mynda Treacy

      May 20, 2016 at 8:39 am

      Good to hear, Sandra πŸ™‚

      Reply
  4. Shreepad S M Gandhi

    October 23, 2013 at 10:14 pm

    Hello Mynda.
    It was interesting and convincing to get to know the drawbacks of Pie-charts. I liked your sentence “Pies are for eating not charting”. You explanation sounds logical. Regards.

    Reply
    • Mynda Treacy

      October 23, 2013 at 10:49 pm

      πŸ™‚ Thanks, Shreepad. Glad you liked it.

      Reply
  5. Helen

    October 23, 2013 at 12:45 am

    Great article! Plus one more downside of pie charts – can’t show negatives that might be there with the positive values (but a bar chart can!)

    Reply
    • Mynda Treacy

      October 23, 2013 at 11:02 am

      Hi Helen,

      Great point about negative values in a pie chart. Thanks for sharing.

      Kind regards,

      Mynda.

      Reply
  6. Mike

    March 15, 2013 at 8:23 am

    Great article. Great examples – and so true πŸ™‚

    Reply
    • Mynda Treacy

      March 15, 2013 at 8:30 am

      Thanks, Mike πŸ™‚

      Reply
  7. Bill

    March 14, 2013 at 3:44 am

    A very creative way to get a point across. Thanks Mynda

    Reply
    • Mynda Treacy

      March 14, 2013 at 6:49 am

      Thanks, Bill πŸ™‚

      Reply
  8. Andres Slack

    March 13, 2013 at 10:18 pm

    Excellent! It’s the best piece I’ve read on the merits (de-merits?) of pie charts.

    Reply
    • Mynda Treacy

      March 14, 2013 at 6:49 am

      Wow, thanks Andres πŸ™‚

      Reply
  9. JOHN LAGAN

    March 13, 2013 at 9:06 am

    Got a giggle out of the pie chart reference but how true. Fantastic comparison

    John L

    Reply
    • Mynda Treacy

      March 13, 2013 at 9:14 am

      πŸ™‚ thanks, John.

      Reply

Leave a Reply Cancel reply

Your email address will not be published. Required fields are marked *

Current ye@r *

Leave this field empty

Sidebar

More results...

Featured Content

  • 10 Common Excel Mistakes to Avoid
  • Top Excel Functions for Data Analysts
  • Secrets to Building Excel Dashboards in Less Than 15 Minutes
  • Pro Excel Formula Writing Tips
  • Hidden Excel Double-Click Shortcuts
  • Top 10 Intermediate Excel Functions
  • 5 Pro Excel Dashboard Design Tips
  • 5 Excel SUM Function Tricks
  • 239 Excel Keyboard Shortcuts

100 Excel Tips and Tricks eBook

Download Free Tips & Tricks

Subscribe to Our Newsletter

Receive weekly tutorials on Excel, Power Query, Power Pivot, Power BI and More.

We respect your email privacy

Guides and Resources

  • Excel Keyboard Shortcuts
  • Excel Functions
  • Excel Formulas
  • Excel Custom Number Formatting
  • ALT Codes
  • Pivot Tables
  • VLOOKUP
  • VBA
  • Excel Userforms
  • Free Downloads

239 Excel Keyboard Shortcuts

Download Free PDF

Free Webinars

Excel Dashboards Webinar

Watch our free webinars and learn to create Interactive Dashboard Reports in Excel or Power BI

Click Here to Watch Now

mynda treacy microsoft mvpHi, I'm Mynda Treacy and I run MOTH with my husband, Phil. Through our blog, webinars, YouTube channel and courses we hope we can help you learn Excel, Power Pivot and DAX, Power Query, Power BI, and Excel Dashboards.

Blog Categories

  • Excel
  • Excel Charts
  • Excel Dashboard
  • Excel Formulas
  • Excel PivotTables
  • Excel Shortcuts
  • Excel VBA
  • General Tips
  • Online Training
  • Outlook
  • Power Apps
  • Power Automate
  • Power BI
  • Power Pivot
  • Power Query
microsoft mvp logo
trustpilot excellent rating
Secured by Sucuri Badge
MyOnlineTrainingHub on YouTube Mynda Treacy on Linked In Mynda Treacy on Instagram Mynda Treacy on Twitter Mynda Treacy on Pinterest MyOnlineTrainingHub on Facebook
 

Company

  • About My Online Training Hub
  • Disclosure Statement
  • Frequently Asked Questions
  • Guarantee
  • Privacy Policy
  • Terms & Conditions
  • Testimonials
  • Become an Affiliate

Support

  • Contact
  • Forum
  • Helpdesk – For Technical Issues

Copyright © 2023 · My Online Training Hub · All Rights Reserved. Microsoft and the Microsoft Office logo are trademarks or registered trademarks of Microsoft Corporation in the United States and/or other countries. Product names, logos, brands, and other trademarks featured or referred to within this website are the property of their respective trademark holders.