• Skip to main content
  • Skip to header right navigation
  • Skip to site footer

My Online Training Hub

Learn Dashboards, Excel, Power BI, Power Query, Power Pivot

  • Courses
  • Pricing
    • Free Courses
    • Power BI Course
    • Excel Power Query Course
    • Power Pivot and DAX Course
    • Excel Dashboard Course
    • Excel PivotTable Course – Quick Start
    • Advanced Excel Formulas Course
    • Excel Expert Advanced Excel Training
    • Excel Tables Course
    • Excel, Word, Outlook
    • Financial Modelling Course
    • Excel PivotTable Course
    • Excel for Customer Service Professionals
    • Multi-User Pricing
  • Resources
    • Free Downloads
    • Excel Functions Explained
    • Excel Formulas
    • Excel Add-ins
    • IF Function
      • Excel IF Statement Explained
      • Excel IF AND OR Functions
      • IF Formula Builder
    • Time & Dates in Excel
      • Excel Date & Time
      • Calculating Time in Excel
      • Excel Time Calculation Tricks
      • Excel Date and Time Formatting
    • Excel Keyboard Shortcuts
    • Excel Custom Number Format Guide
    • Pivot Tables Guide
    • VLOOKUP Guide
    • ALT Codes
    • Excel VBA & Macros
    • Excel User Forms
    • VBA String Functions
  • Members
    • Login
  • Blog
  • Excel Webinars
  • Excel Forum
    • Register as Forum Member

Excel Chart Templates

You are here: Home / Excel Charts / Excel Chart Templates
Excel Chart Templates
April 22, 2014 by Mynda Treacy

If you find yourself repeatedly spending a few minutes customising your chart colours, formatting the title, legend, axis labels etc. every time you insert a new chart, then you might consider setting up your own chart templates.

Think of them like man’s best friend, the dog; always at your side.

Chart templates are on hand via the Charts menu at the click of a button….well a few buttons, but it’ll still be quicker than faffing about with all those formatting menus.

Save a Custom Chart Template

It’s dead easy to create your own chart template:

  1. For Excel 2007 and 2010 select the chart you want to save as a template.
  2. On the Chart Tools: Design tab of the ribbon click on the ‘Save As Template’ button:
  3. Excel Chart Template icon

    Note: You won’t find this menu in Excel 2013, instead right-click the chart and select ‘Save as Template’.

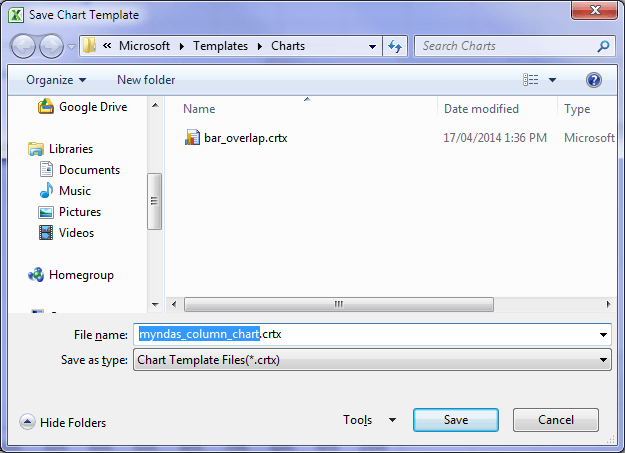
  4. This will open the ‘Save Chart Template’ save as dialog box. You’ll notice the file type is .crtx. Give your template a name then click ‘Save’:
  5. Excel Chart Template Save As dialog box

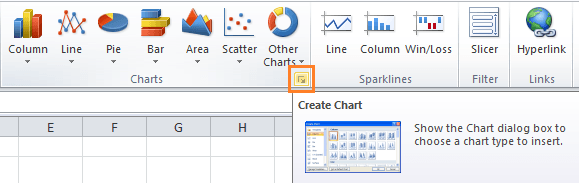
  6. Next time you’re ready to insert a chart you’ll find your templates in the ‘Insert Chart’ dialog box. To access this go to the Chart tab of the ribbon and click on the small arrow in the bottom of the ‘Charts’ group:
  7. finding Excel Chart Templates

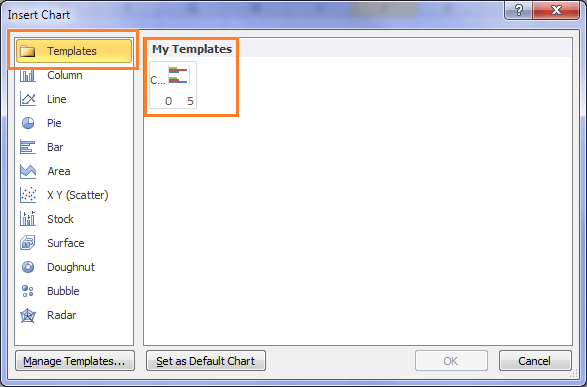
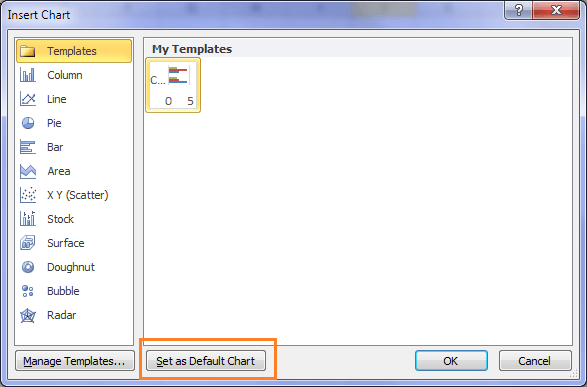
  8. Select the ‘Templates’ from the list on the left and your custom chart templates list will appear (in 2007 & 2010 the icons aren’t very helpful as you can see in the image below):

Chart Template menu

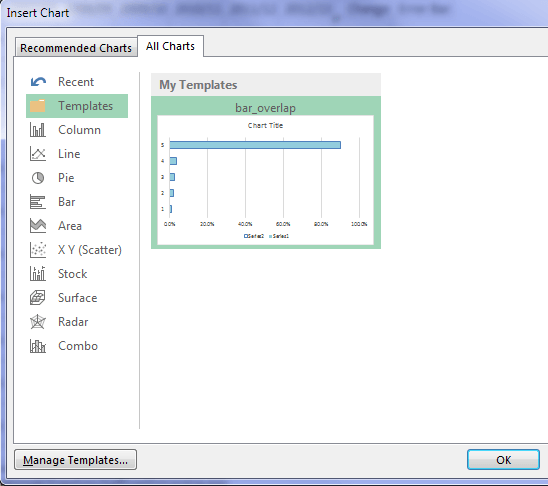
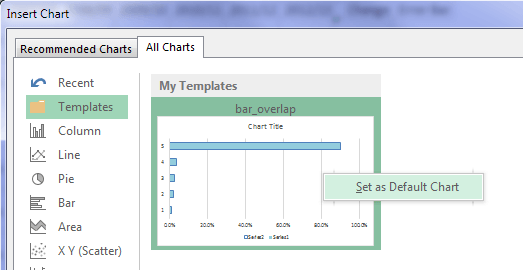
Thankfully in 2013 (image below) they’re much better as you can actually see the file name of your templates and a preview of the chart. Note however that you need to go to the ‘All Charts’ tab to find your Templates:

Chart Template menu Excel 2013

Warnings

This works for fairly basic charts but if you’ve done some unconventional modifications to the standard charts (like those I teach in my Excel Dashboard course) then you might find that Excel doesn’t know how to use your Custom Template, or worse it crashes (as it did for me in Excel 2013). It seemed to be fine with regular chart types though.

Managing Chart Templates

You can delete and rename templates via the ‘Manage Templates’ button as seen in the bottom left of the ‘Insert Chart’ dialog boxes above.

When you click on the ‘Manage Templates’ button Excel opens the folder where your templates are stored. You can edit the files just like any other:

  • Delete: Select the file and press the DELETE key
  • Rename: Select the file and press F2 to rename the template

Default Charts

You can even set one of your templates as the ‘Default Chart’:

Excel 2007 & 2010: select your chart from the list of template charts > click the ‘Set as Default Chart’ button in the ‘Insert Chart’ dialog box.

default charts

Excel 2013: right click the template in the ‘All Charts’ tab of the ‘Insert Chart’ dialog box and select ‘Set as Default Chart’:

default charts 2013

Now with all that spare time you have on your hands you can take an extended lunch break 🙂

Excel Chart Templates

More Excel Charts Posts

excel speedometer charts

Excel Speedometer Charts

How to build Excel Speedometer Charts or Gauge Charts as they're also know, why they are BAD and what to use instead.
burn up burn down charts

Excel Project Management Burn Down and Burn Up Charts

Excel Burn Down and Burn Up Charts are easy to make with line or scatter charts. They are useful for monitoring the progress of a project.
wee people font charts

Excel WeePeople Font Charts

Excel WeePeople Font Charts are a nice change from generic shapes for waffle charts, bar/column charts and more.
excel dot map charts

Excel Dot Map Charts

Interactive Excel dot map charts are not built-in, but with some creative use of Excel’s built-in tools we can create something unique.
Excel S Curve Charts

Excel S-Curve Charts

Easy Excel S-curve Charts made with PivotTables for project management. Track progress by including budget amounts.
chart axis switch

Excel Chart Axis Switch

Use radio button form controls to create an Excel chart axis switch enabling you to toggle pannel charts between same axis and own axis.

Excel Charts with Shapes for Infographics

Excel Charts with Shapes for Infographic styling and increased interest in your charts. Easy to insert but there are a few tricks required.
excel pyramid chart

Excel Pyramid Charts

Excel Pyramid charts are useful for visualising demographic data across multiple categories. Let’s look at 3 ways we can build them in Excel.

Highlighting Periods in Excel Charts

Highlighting Periods in Excel Charts helps your users interpret them more quickly and or focus their attention on a point or area.
stacked bar waffle chart

Stacked Bar Excel Waffle Charts

Stacked Bar Excel Waffle Charts are an alternate to using conditional formatting to build waffle charts, and some say they're easier.
Category: Excel Charts
Previous Post:Create Hyperlinked List of Files in a Folder Using VBACreate Hyperlinked List of Files in a Folder Using VBA
Next Post:Conditional Formatting PivotTablesConditional Formatting PivotTables

Reader Interactions

Comments

  1. Vladimir

    January 4, 2023 at 5:25 am

    Good time of day. Please tell me how to build a diagram with an area in excel so that the border is rounded. Thanks

    Reply
    • Catalin Bombea

      January 5, 2023 at 8:10 pm

      Hi Vladimir,
      Right click the chart, select Format Chart Area, then click Border Styles tab in the Format Chart Area dialog, and check Rounded corners option.

      Reply
  2. Steve B

    March 9, 2021 at 2:49 am

    Hello Mynda!
    I’m new here, just signed up today. But old, 73 now. I’m trying to understand dashboards and have a problem formatting line charts.
    for example, we have many clients, each client has revenue, personnel costs, material costs, motor pool costs, etc., etc.
    My idea is to have, for each client, every revenue line green, every personnel lagine red, every motor pool line blue, etc. and I would like every line to be, say, 4 pts. wide.
    Does one HAVE to format each line separately, or is there a tick to accomplish what I would like?
    Maybe you have a video that I haven’t found yet!!ag
    Thanks,ag
    Steve
    Steve

    Reply
    • Mynda Treacy

      March 9, 2021 at 8:54 am

      Hi Steve,

      Yes, you have to format every line separately, but once you do one chart you can copy the chart for the other clients and the formatting will stick.

      Mynda

      Reply
  3. Saskia

    June 14, 2018 at 10:04 pm

    This way of making your own chart templates is personal. Is there a way to distribute it (like normal templates) for a whole company?

    Reply
    • Mynda Treacy

      June 15, 2018 at 8:28 am

      Hi Saskia,

      Yes, you can share the .crtx files with your colleagues just as you might share any other Excel file. They then need to save it in their templates folder for use in their version of Excel.

      Mynda

      Reply
  4. Bryan

    April 23, 2014 at 9:10 pm

    But… messing with the formatting every time is half the fun!

    Reply
    • Mynda Treacy

      April 23, 2014 at 9:15 pm

      🙂 Bryan, I think you’ve got too much time on your hands!

      Reply
  5. Jon Acampora

    April 23, 2014 at 6:46 am

    Great tutorial Mynda! I provide templates in some of my tutorials and now I have a great resource to point readers too if they want to learn how to make their own. Thanks for sharing!

    Reply
    • Mynda Treacy

      April 23, 2014 at 9:55 am

      Cheers, Jon 🙂

      Reply
  6. EL

    April 22, 2014 at 7:01 pm

    Really nice suggestions there. A lot of users don’t have the idea how to use chart templates in Excel. This explains it very clearly. Thanks for sharing.

    Reply
    • Mynda Treacy

      April 22, 2014 at 7:54 pm

      Thanks, EL 🙂

      Reply

Leave a Reply Cancel reply

Your email address will not be published. Required fields are marked *

Current ye@r *

Leave this field empty

Sidebar

More results...

Shopping Cart

mynda treacy microsoft mvpHi, I'm Mynda Treacy and I run MOTH with my husband, Phil. Through our blog, webinars, YouTube channel and courses we hope we can help you learn Excel, Power Pivot and DAX, Power Query, Power BI, and Excel Dashboards.

Subscribe to Our Newsletter

Receive weekly tutorials on Excel, Power Query, Power Pivot, Power BI and More.

We respect your email privacy

Guides and Resources

  • Excel Keyboard Shortcuts
  • Excel Functions
  • Excel Formulas
  • Excel Custom Number Formatting
  • ALT Codes
  • Pivot Tables
  • VLOOKUP
  • VBA
  • Excel Userforms
  • Free Downloads

239 Excel Keyboard Shortcuts

Download Free PDF

Free Webinars

Excel Dashboards Webinar

Watch our free webinars and learn to create Interactive Dashboard Reports in Excel or Power BI

Click Here to Watch Now
  • Excel
  • Excel Charts
  • Excel Dashboard
  • Excel Formulas
  • Excel PivotTables
  • Excel Shortcuts
  • Excel VBA
  • General Tips
  • Online Training
  • Outlook
  • Power Apps
  • Power Automate
  • Power BI
  • Power Pivot
  • Power Query
 
  • About My Online Training Hub
  • Contact
  • Disclosure Statement
  • Frequently Asked Questions
  • Guarantee
  • Privacy Policy
  • Terms & Conditions
  • Testimonials
  • Become an Affiliate

Copyright © 2023 · My Online Training Hub · All Rights Reserved

Microsoft and the Microsoft Office logo are trademarks or registered trademarks of Microsoft Corporation in the United States and/or other countries. Product names, logos, brands, and other trademarks featured or referred to within this website are the property of their respective trademark holders.

Download A Free Copy of 100 Excel Tips & Tricks

excel tips and tricks ebook

We respect your privacy. We won’t spam you.

x