
December 3, 2019
Excel XOR Function
The Excel XOR function, or ‘exclusive OR’ as it’s known in the programming world, performs a test on an array,
Read More
December 3, 2019
The Excel XOR function, or ‘exclusive OR’ as it’s known in the programming world, performs a test on an array,
Read More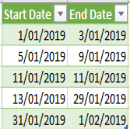
November 28, 2019
A few weeks ago, Matt asked if we could extract start and end dates with Power Query. He has a
Read More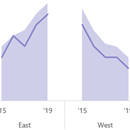
November 19, 2019
Reduce clutter in busy line charts by plotting your data in small multiple charts, or panel charts as they’re sometimes
Read More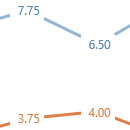
November 12, 2019
Labeling charts is useful if the reader needs to know the exact value for each point. We can position labels
Read More
November 6, 2019
Often, you’ll find Actual vs Target charts based on categorical data in the form of a column chart, however they’re
Read More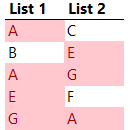
October 22, 2019
Comparing two lists is easily done with Power Query, but maybe you prefer to use a formula to extract values
Read More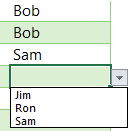
October 15, 2019
Creating a reducing Data Validation list is easy with the new dynamic array formulas. Let’s say we have a list
Read More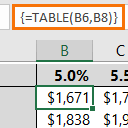
September 19, 2019
Excel Data Tables are one of the What-if Analysis tools that we have available to aid our decision making. They
Read More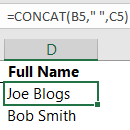
September 12, 2019
The Excel CONCAT function, new in Excel 2019, replaces the legacy CONCATENATE function*. It’s a simple function that joins the
Read More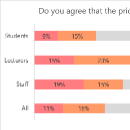
August 22, 2019
Charting survey data can be tricky, and when you want a segmented survey data chart it adds another layer of
Read More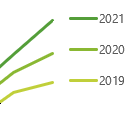
August 14, 2019
Year on year charts or data over time is one of the most common data visualisations you’ll see. However, the
Read More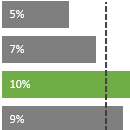
August 8, 2019
In this post I’m going to show you a way to create an Excel bar chart with a vertical line.
Read More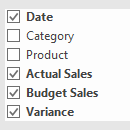
July 16, 2019
The Excel PivotTable field list automatically appears in the task pane on the right-hand side of the Excel window when
Read More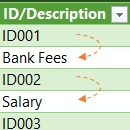
July 9, 2019
Unlike Excel, referencing the next row in Power Query, or even the previous row, is not as simple as we
Read More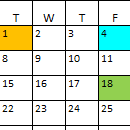
June 25, 2019
There are many Excel Calendar templates available and if you look at them closely, you’ll see they have some mind-boggling
Read More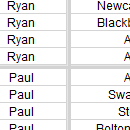
June 3, 2019
One of my bugbears is opening an Excel workbook that has Split Panes set when it should have Freeze Panes
Read More
May 21, 2019
Previously we looked at scraping data from the web by example, where the website paginated the data. That is, it
Read More
May 14, 2019
Getting data from the web is possible with Power Query in both Excel and Power BI. However, Excel is a
Read More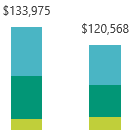
May 6, 2019
If you work with PivotTables, then you’ve probably found that you can’t include grand totals in Pivot Charts, or subtotals
Read More
April 16, 2019
A while ago I wrote about to how perform the equivalent of an Excel exact match VLOOKUP formula with Power
Read More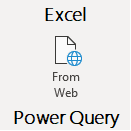
March 28, 2019
The ability to get data from the web with Power Query is super handy and Power Query’s user-friendly GUI makes
Read More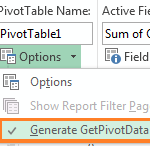
March 14, 2019
The GETPIVOTDATA function divides Excel users. You either love it or hate it, but there are good reasons for learning
Read More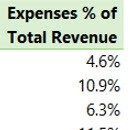
March 7, 2019
Occasionally you may want to show values as percentage of another PivotTable column total. For example, below we want to
Read More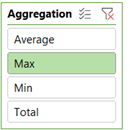
February 12, 2019
With disconnected tables in Power Pivot* we can change PivotChart aggregation methods using Excel Slicers. It allows us to create
Read More
January 30, 2019
Creating an Excel five star rating chart is easy with Conditional Formatting. They’re not limited to stars, you can also
Read More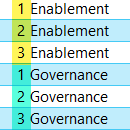
January 24, 2019
Numbering items within grouped data is easy with an Excel COUNTIF formula, but numbering grouped data in Power Query requires
Read More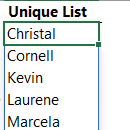
January 8, 2019
I really wanted the title of this post to be “Excel Sorted Dynamic Unique List Ignoring Blanks and Errors”, but
Read More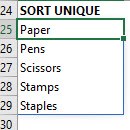
December 6, 2018
If you’re familiar with array formulas, then the simplicity of Excel Dynamic Arrays will be a breath of fresh air.
Read More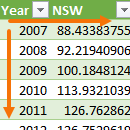
November 15, 2018
The options in the Pivot Chart library are limited, which you’ll know if you’ve ever tried to create a Scatter
Read More
November 8, 2018
Ok, that title is a lie. There’s no such thing as an Excel Scatter Pivot Chart. It’s like mixing water
Read More