
January 21, 2021
Highlighting Periods in Excel Charts
Shading or highlighting periods in Excel charts can help users more quickly interpret them and identify patterns. In the chart
Read More
January 21, 2021
Shading or highlighting periods in Excel charts can help users more quickly interpret them and identify patterns. In the chart
Read More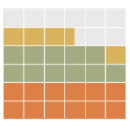
December 10, 2020
Last week we looked at building Excel waffle charts using Conditional Formatting. This week we’re looking at building Stacked Bar
Read More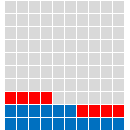
December 3, 2020
Excel Waffle Charts are a popular way to visually display parts to a whole. You can think of them as
Read More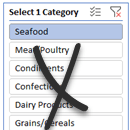
November 19, 2020
There’s no built-in way we can force Excel Slicers to single select, but we can use some crafty tricks to
Read More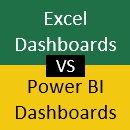
November 10, 2020
One of the most common questions I get is: Should I be using Power BI to build dashboards instead of
Read More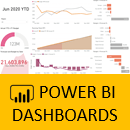
November 3, 2020
Demand for data visualisation skills is showing no signs of slowing. There are many BI tools available, and this can
Read More
October 15, 2020
What’s the big deal about Power Query? Talk to those who have used it and they’ll tell you how amazing
Read More
October 1, 2020
You may already be familiar with Excel Data Types for geography and stocks, but with Power Query Custom Data types
Read More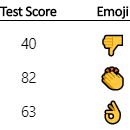
September 17, 2020
Custom number format conditions allow you to specify a different format based on the size of a number. In this
Read More
August 27, 2020
A new feature in the Excel mobile app (iPhone and Android) is the ability to take a photo of your
Read More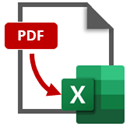
August 13, 2020
Office 365/Microsoft 365 users can now import data from a PDF to Excel using Power Query*. It’s super handy for
Read More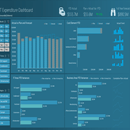
August 11, 2020
Reporting on plan v actual variances can be a very dry topic and often the audience for these reports are
Read More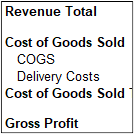
July 30, 2020
Creating an Excel PivotTable Profit and Loss statement is surprisingly easy. And because it’s a PivotTable you can team it
Read More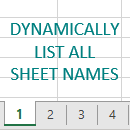
July 16, 2020
Navigating workbooks with lots of sheets can be tedious. In this tutorial I’m going to show you how to dynamically
Read More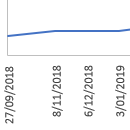
July 9, 2020
When you have data that spans a long period of time that you want to plot in a chart, the
Read More
June 25, 2020
Using a formula to return a reference to a range of cells allows us to generate a reference on the
Read More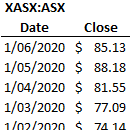
June 18, 2020
With the new Excel STOCKHISTORY function we can finally get historical price data for stocks, bonds, funds, crypto and foreign
Read More
June 11, 2020
The Excel INDEX function is a treasure trove of functionality, but most of us only know one way to use
Read More
May 13, 2020
Excel Forms are super useful if you collate data manually, for example via email or PDF forms. Or even if
Read More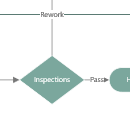
April 30, 2020
Office 365 users now have access to the Visio for Excel free add-in enabling you to create Excel flow charts
Read More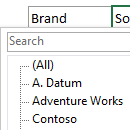
April 9, 2020
Creating this searchable drop down list in Excel is so easy I’m wondering why I never thought of it before.
Read More
April 2, 2020
In this post we’re going to look at how you can import multiple files containing multiple sheets with Power Query,
Read More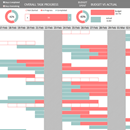
March 25, 2020
Managing projects or tasks can be improved with a visual representation of progress and milestones. Thankfully, an Excel project management
Read More
March 5, 2020
This post contains 20 Excel keyboard shortcuts used by Excel pros. I’m not talking about CTRL+Z, and the like, these
Read More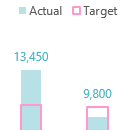
February 20, 2020
When you plot multiple series in a chart the labels can end up overlapping other data. A solution to this
Read More
February 13, 2020
We can use a data validation list or a Slicer to lookup pictures in Excel. This ability to lookup pictures
Read More
February 6, 2020
One of the cool features in Power BI is the ability to cross highlight from one chart to another by
Read More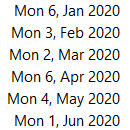
January 23, 2020
With Excel formulas we can easily list the first Monday date in each month, or the last Sunday, or whatever
Read More
January 8, 2020
Oh, how I wish I’d had the fortune of the new Excel XLOOKUP function back in my accounting days. The
Read More
December 11, 2019
Excel Hash is an Excel competition dreamed up by fellow Excel MVP, Oz du Soleil. It’s based on the popular
Read More