• Skip to main content
  • Skip to header right navigation
  • Skip to site footer

My Online Training Hub

Learn Dashboards, Excel, Power BI, Power Query, Power Pivot

  • Courses
  • Pricing
    • Free Courses
    • Power BI Course
    • Excel Power Query Course
    • Power Pivot and DAX Course
    • Excel Dashboard Course
    • Excel PivotTable Course – Quick Start
    • Advanced Excel Formulas Course
    • Excel Expert Advanced Excel Training
    • Excel Tables Course
    • Excel, Word, Outlook
    • Financial Modelling Course
    • Excel PivotTable Course
    • Excel for Customer Service Professionals
    • Excel for Operations Management Course
    • Excel for Decision Making Under Uncertainty Course
    • Excel for Finance Course
    • Excel Analysis ToolPak Course
    • Multi-User Pricing
  • Resources
    • Free Downloads
    • Excel Functions Explained
    • Excel Formulas
    • Excel Add-ins
    • IF Function
      • Excel IF Statement Explained
      • Excel IF AND OR Functions
      • IF Formula Builder
    • Time & Dates in Excel
      • Excel Date & Time
      • Calculating Time in Excel
      • Excel Time Calculation Tricks
      • Excel Date and Time Formatting
    • Excel Keyboard Shortcuts
    • Excel Custom Number Format Guide
    • Pivot Tables Guide
    • VLOOKUP Guide
    • ALT Codes
    • Excel VBA & Macros
    • Excel User Forms
    • VBA String Functions
  • Members
    • Login
  • Blog
  • Excel Webinars
  • Excel Forum
    • Register as Forum Member
  • Login

Excel Data Tables

You are here: Home / Excel Formulas / Excel Data Tables
excel data tables
September 19, 2019 by Mynda Treacy

Excel Data Tables are one of the What-if Analysis tools that we have available to aid our decision making. They don't require knowledge of any new fancy formulas and are super quick to build.

With Excel Data Tables we can perform what-if analysis with one or two variables, which makes it quick and easy to experiment and understand the outcome of different options.

Watch the Video

Subscribe YouTube

Download the Workbook

Enter your email address below to download the sample workbook.

By submitting your email address you agree that we can email you our Excel newsletter.
Please enter a valid email address.

Download the Excel Workbook and follow along. Note: This is a .xlsx file please ensure your browser doesn't change the file extension on download.

One Variable Data Tables

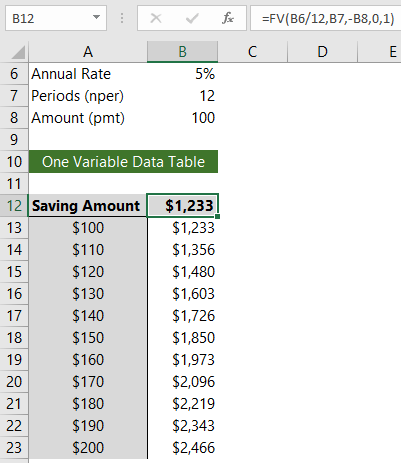
In cell B12 (image below) I’ve used the FV function (future value) to calculate the amount we’ll have after 12 months of saving $100 at the beginning of each month at a 5% interest rate p.a., which results in $1233.

Note: The FV function syntax is:

=FV(rate, nper, [pmt], [pv], [type])

I’ll be adjusting the pmt argument in this one variable data table what-if analysis.

What if we increased our monthly savings amount by $10 or $20 or more? It’s easy to see the effect of the change in the savings amount [pmt] with a Data Table:

savings data table

Creating Excel Data Tables

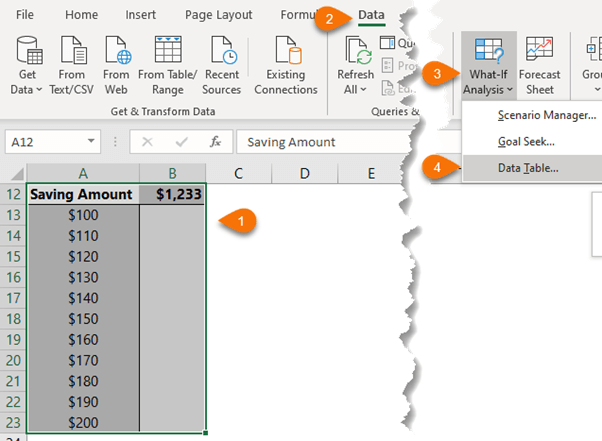
Set up a table that contains your variables going down the rows or across the columns. In this example my monthly payments are in column A.

Place your formula or a link to your formula in the cell above where your data table will place the values. In my case this is cell B12.

Next, select the cells containing the variables and the cells your results will be entered in. In this example it’s cells A12:B23. Go to the Data tab > What-if Analysis > Data Table, as shown below:

Excel data tables

In the Data Table dialog box, shown below, select the cell that contains the variable referenced in the formula in cell B12, which is B8:

data table example 2

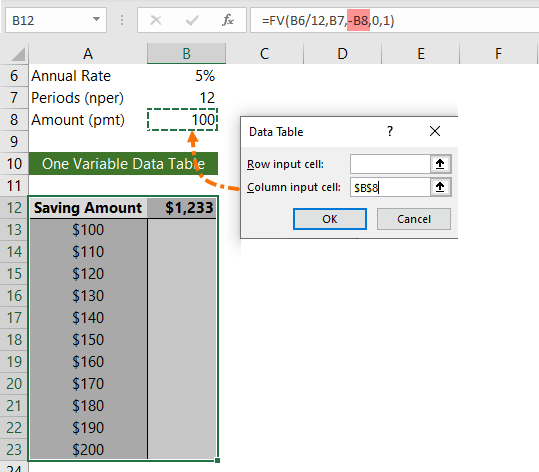
Note: As this is a single variable data table, I can leave the row input cell empty.

That’s it. Easy peasy!

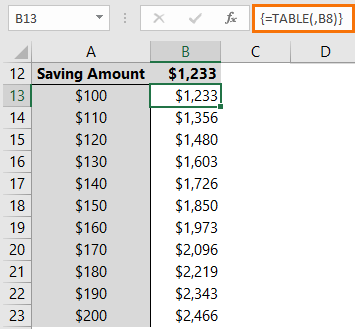
Notice the formula bar in the image below contains the TABLE function. The only way the TABLE function can be entered in the worksheet is via the Data tab > What-if Analysis > Data Table. You won’t even find it in the Function Wizard.

data table example 3

Tip: Because the data table contains a formula, you can make changes to your variables and it will automatically update.

Two Variable Data Tables

We can compare changes in the saving amount [pmt] and the interest rate [rate] using a two variable data table. In the image below I have the interest rates across row 12 and the savings amounts in column A:

two variable data table 1

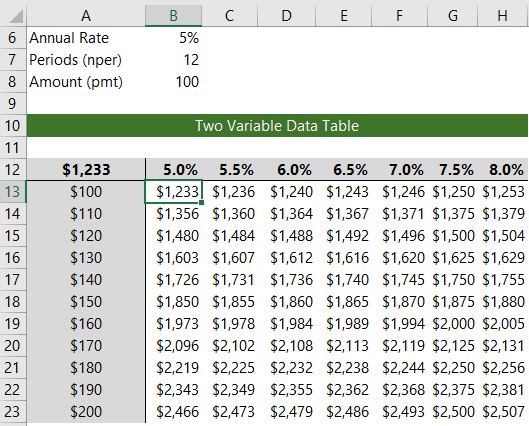
Note: your formula or a link to your formula must be in the top left cell of the table. In my case, cell A12.

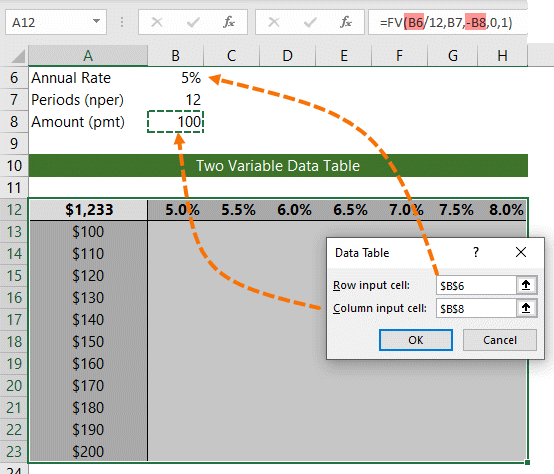
The process is the same, except this time I need to select cells A12:H23 and in the Data Table dialog box I choose cell B6 as my row input cell and B8 as my column input cell:

two variable data table 2

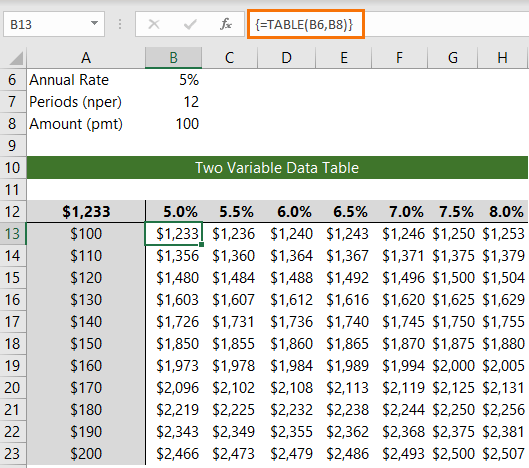
Notice the TABLE formula in the image below contains two cell references, one for the row variable and one for the column variable:

two variable data table 3

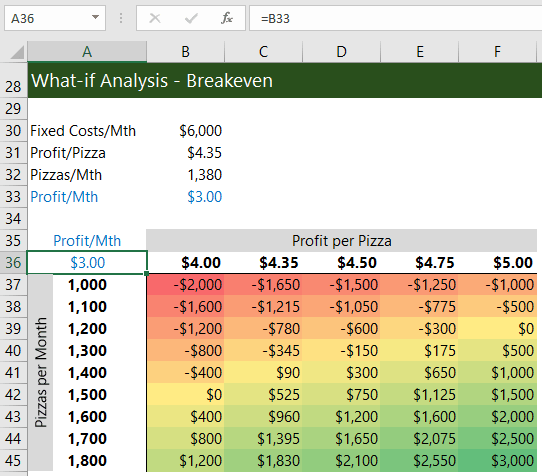
Breakeven Data Tables

There are many uses for Data Tables. Another is to calculate and visualise breakeven. With the help of Conditional Formatting heat maps we can see the breakeven curve for profit per month (in the image below) runs from 1500 pizzas at $4.00 profit per pizza through to 1200 pizzas at $5 profit per pizza:

breakeven data table

Spoiler: Of course, you could achieve the same results as a data table by inserting your formula in cells B37:F45 and simply reference the cells that contain the variables in row 36 and column A. But at least now when you stumble upon a workbook containing this mysterious TABLE function you’ll know what it is and how it got there 😉

excel data tables
Mynda Treacy

Microsoft MVP logo

AUTHOR Mynda Treacy Co-Founder / Owner at My Online Training Hub

CIMA qualified Accountant with over 25 years experience in roles such as Global IT Financial Controller for investment banking firms Barclays Capital and NatWest Markets.

Mynda has been awarded Microsoft MVP status every year since 2014 for her expertise and contributions to educating people about Microsoft Excel.

Mynda teaches several courses here at MOTH including Excel Expert, Excel Dashboards, Power BI, Power Query and Power Pivot.

More Excel Formulas Posts

Excel BYROW and BYCOL Functions

Excel BYCOL and BYROW Functions

Excel BYCOL and BYROW functions fundamentally change the way we write formulas that calculate across columns and down rows.
python in excel natively

How to Use Python in Excel Natively

How to use Python in Excel natively using libraries like Pandas, NumPy, Matplotlib, Seaborn and more for analysis and spectacular charts!
excel dynamic named ranges

Excel Dynamic Named Ranges

Excel Dynamic Named Ranges update automatically to include new data in the ranges referenced in your formulas and PivotTables etc.
functions for financial modelling

Excel Functions for Financial Modeling

Top 23 must know Excel functions for Financial Modeling. Includes example Excel file and step by step instructions.
excel formula by example

Excel Formula by Example

Excel can now write a formula by example. Simply give it an example or two of the result and Excel will write the formula.
ai-aided excel formula editor

AI Aided Excel Formula Editor

Save time with this free AI Excel formula editor add-in that writes, edits, improves and interprets formulas for you!
top excel functions for data analysts

Top Excel Functions for Data Analysts

Must know Excel Functions for Data Analysts and what functions you don’t have to waste time learning and why.
excel advanced formula environment

Excel Labs (Formerly, Advanced Formula Environment)

Excel Labs is a long awaited, new improved way to write, name and store Excel formulas, including LAMBDAS with the help of AI.
Pro Excel Formula Writing Tips

Pro Excel Formula Writing Tips

Must know Excel formula writing tips, tricks and tools to make you an Excel formula ninja, including a new formula editor.
excel shaping arrays

New Array Shaping Excel Functions

The Excel Shaping Array Functions makes it easier than ever to reshape arrays and ranges using these purpose built functions


Category: Excel Formulas
Previous Post:Excel CONCAT FunctionExcel CONCAT Function
Next Post:Extracting Date and Time from a DateTime ValueExtract Date and Time from DateTime Value

Reader Interactions

Comments

  1. Abbott Katz

    January 8, 2021 at 3:35 am

    For an Excel 365 non-data table alternative, enter in B13:

    =FV(B6/12,B7,-A13:A23,0,1)

    Reply
  2. Tatiana Petkova

    October 3, 2019 at 7:23 pm

    Hi, Mynda
    I saw that if our variables are formulas (referred to the cell B8) – in column Saving Amount – the calculations aren’t correct. Why? Does it work only with values, not formulas?

    Reply
    • Mynda Treacy

      October 4, 2019 at 1:24 pm

      Hi Tatiana,

      I can’t reproduce that error. Please post your question and sample Excel file on our forum where we can take a look.

      Mynda

      Reply
  3. Steve Olson

    September 20, 2019 at 5:02 am

    What a great reminder. There was an old Journal of Accountancy article on this very thing by Stephanie Bryant years ago. An extra tip is that in a 2 variable input table the results cell must be referenced in the top left corner of the table. That confuses people, so the suggestion is to format that cell (A12) using Format Cells, Custom and typing in “Savings Amt” with the quotes in the Type: box. The formula is still the same, but the viewer will see it as a Savings Amt header instead of $1,671.

    Reply
    • Mynda Treacy

      September 20, 2019 at 7:56 am

      Great tip, Steve! Thanks for sharing.

      Reply
  4. Colin

    September 20, 2019 at 4:05 am

    Hi Mynda,,

    The last part of the tutorial regarding the heat map. I deleted from B37:F45 and attempted to replicate. If I select the entire table go to what-of analysis and choose cell Row input cell B31 and Column input cell B32, I seem to populate the table with “Profit/Mth” in every cell. Where am I going wrong?

    Thanks,
    Colin

    Reply
    • Mynda Treacy

      September 20, 2019 at 7:55 am

      Hi Colin,

      After deleting the data in cells B37:F45 you need to select cells A36:F45. The result should be profit per month adjusted for the different profit per pizza and pizzas per month figures.

      Mynda

      Reply
  5. Danny Eisenbacher

    September 20, 2019 at 3:08 am

    I enjoyed your explanation. I was confused at first that the results of the two variable data table were different than the one variable data table until I realized the formula was different between the two of them. Once the formula was changed then the result is the same for the two examples.

    Reply
    • Mynda Treacy

      September 20, 2019 at 7:50 am

      Thanks, Danny. Yes, two variable data tables have two references in the TABLE formula, as shown in the image just above the Breakeven Analysis heading. Glad you had a chance to play around with them.

      Reply
  6. Ron S

    September 19, 2019 at 11:40 pm

    One point you haven’t mentioned is OneDrive.
    .
    I’ve seen many comments from people complaining about files stored in OneDrive. The (relatively) new Autosave on OneDrive is on by default. That means all changes are saved almost in real time. People are used to working on files saved to the local drive. You can open a file, do some “what-if” changes, then close WITHOUT saving so that file is “clean” the next time you open it. That is NOT possible on OneDrive unless you remember to turn off AutoSave.
    .
    It’s a small thing, but can be annoying if you are not aware of it

    Reply
    • Mynda Treacy

      September 20, 2019 at 7:48 am

      Yes Ron, AutoSave is very annoying at first. We MVPs kicked up a big stink about it when it was first released, but I confess that I am a convert. If you don’t like AutoSave you can disable it upon opening the file by clicking the toggle in the top left or you can turn it off in the File tab > Options > Save > Save Workbooks group.

      Mynda

      Reply
  7. Don

    September 19, 2019 at 10:52 pm

    Mynda,

    This type of Data Table is completely new to me. Can you explain how this type of a Data Table is different than the tables I’m used to using extensively with Insert > Table? The first thing I notice is that is I select a cell within the Data Table in your example is that I don’t see the ‘usual’ Table Tools > Design menu highlighted.

    Thank you for highlighting this use for Data Tables with What-If’s.

    Reply
    • Mynda Treacy

      September 20, 2019 at 7:46 am

      Hi Don,

      These Data Tables have no relationship to the Excel Tables on the Insert tab which are designed to organise and help you reference and work with your data. Whereas Data Tables are an automatic what-if analysis tool.

      Mynda

      Reply

Leave a Reply Cancel reply

Your email address will not be published. Required fields are marked *

Current ye@r *

Leave this field empty

Sidebar

More results...

Popular Content

  • 10 Common Excel Mistakes to Avoid
  • Top Excel Functions for Data Analysts
  • Secrets to Building Excel Dashboards in Less Than 15 Minutes
  • Pro Excel Formula Writing Tips
  • Hidden Excel Double-Click Shortcuts
  • Top 10 Intermediate Excel Functions
  • 5 Pro Excel Dashboard Design Tips
  • 5 Excel SUM Function Tricks
  • 239 Excel Keyboard Shortcuts

100 Excel Tips and Tricks eBook

Download Free Tips & Tricks

239 Excel Keyboard Shortcuts

Download Free PDF

mynda treacy microsoft mvpHi, I'm Mynda Treacy and I run MOTH with my husband, Phil. Through our blog, webinars, YouTube channel and courses we hope we can help you learn Excel, Power Pivot and DAX, Power Query, Power BI, and Excel Dashboards.

Blog Categories

  • Excel
  • Excel Charts
  • Excel Dashboard
  • Excel Formulas
  • Excel Office Scripts
  • Excel PivotTables
  • Excel Shortcuts
  • Excel VBA
  • General Tips
  • Online Training
  • Outlook
  • Power Apps
  • Power Automate
  • Power BI
  • Power Pivot
  • Power Query
microsoft mvp logo
trustpilot excellent rating
Secured by Sucuri Badge
MyOnlineTrainingHub on YouTube Mynda Treacy on Linked In Mynda Treacy on Instagram Mynda Treacy on Twitter Mynda Treacy on Pinterest MyOnlineTrainingHub on Facebook

Sign up to our newsletter and join over 400,000
others who learn Excel and Power BI with us.


Company

  • About My Online Training Hub
  • Disclosure Statement
  • Frequently Asked Questions
  • Guarantee
  • Privacy Policy
  • Terms & Conditions
  • Testimonials
  • Become an Affiliate
  • Sponsor Our Newsletter

Support

  • Contact
  • Forum
  • Helpdesk – For Technical Issues

Copyright © 2023 · My Online Training Hub · All Rights Reserved. Microsoft and the Microsoft Office logo are trademarks or registered trademarks of Microsoft Corporation in the United States and/or other countries. Product names, logos, brands, and other trademarks featured or referred to within this website are the property of their respective trademark holders.