The Excel Forecast Sheet and charts are a new feature available in Excel 2016. In just a few clicks you can get a forecast done for you, including a chart like the one below:
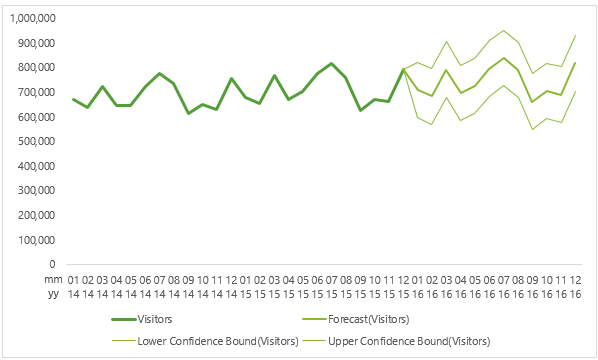
This new forecasting tool creates a copy of your data and inserts it on a new sheet in your file, along with the forecast formulas to predict the future values, and all presented in a chart.
Watch the Video

Download Workbook and Take a Look
Note, this workbook contains functions only available in Excel 2016 or later. If you don’t have Excel 2016 then you can’t edit the FORECAST.ETS… formulas.
Enter your email address below to download the sample workbook.
Data Required for Excel Forecast Sheet
All you need is some historical time-based data in a tabular format. Excel needs a column containing the dates/times at consistent intervals, and a column containing the values.
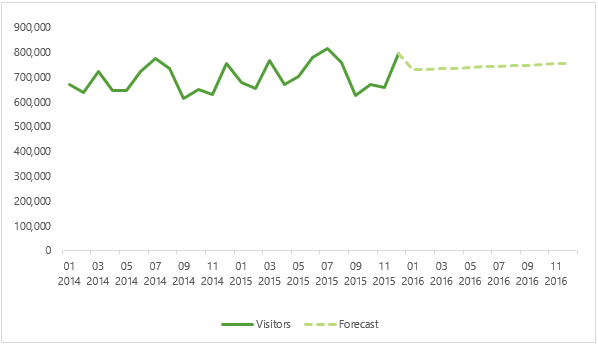
For example, below is the data I’m using, which is visitor numbers to Hawaii:
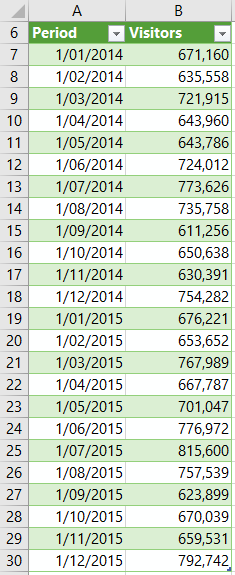
Data source: HTA and DBEDT
Note: Your date/time data can be missing up to 30% of the data points or have several numbers with the same time stamp. Excel will average the data with the same time stamp. However, summarizing data before you create the forecast will produce more accurate forecast results.
Inserting Excel Forecast Sheets
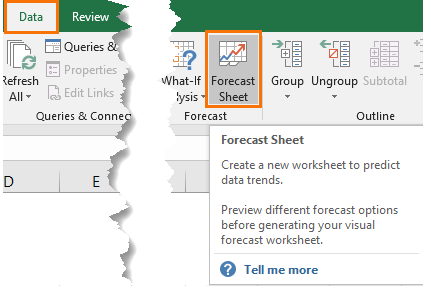
To insert a Forecast chart, start by selecting your data, or if it’s a contiguous range just select a cell in the table > Data tab > Forecast Sheet:
This opens the Create Forecast Worksheet dialog box, shown below, where you can choose the chart type (1) and when to end the forecast (2):
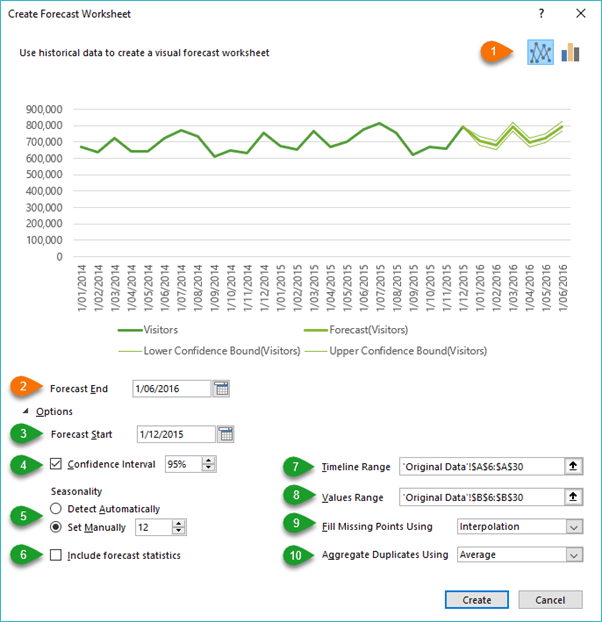
Clicking on ‘Options’, below the ‘Forecast End’ field, reveals more settings. These are explained as follows (numbers below correspond to image above):
| Forecast Options | Description |
| Forecast Start (3) | This is the date the forecast begins. By default, it’s the end of your data, but if you want to exclude data from the forecast then you can choose a date before the end of the historical data. This will only include data prior to the ‘start date’ in the forecast (this is sometimes referred to as "hindcasting").
Tips:
|
| Confidence Interval (4) | The confidence interval is the range surrounding each predicted value, in which 95% of future points are expected to fall, based on the forecast (with normal distribution). These are the two finer lines either side of the forecast line (or if you choose the column chart option they are the error bar values). The confidence interval can help you get a feel for the accuracy of the forecast. A smaller interval implies more confidence for the specific point. Change the default level using the up or down arrows, or turn confidence intervals off by unchecking the box. |
| Seasonality (5) | Seasonality is a number for the length (number of points) of the seasonal pattern and is automatically detected. For example, in a yearly sales cycle, with each point representing a month, the seasonality is 12. You can override the automatic detection by choosing Set Manually and then entering a number. When the seasonality is not significant enough for the algorithm to detect, the prediction will revert to a linear trend. The default value of 1 means Excel detects seasonality automatically for the forecast and uses positive, whole numbers for the length of the seasonal pattern. 0 indicates no seasonality, meaning the prediction will be linear. Note: When setting seasonality manually, avoid a value for less than 2 cycles of historical data. With less than 2 cycles, Excel cannot identify the seasonal components. |
| Include Forecast Statistics (6) | Excel can automatically generate a table of statistics using the FORECASE.ETS.STAT function, including measures such as the smoothing coefficients (Alpha, Beta, Gamma), and error metrics (MASE, SMAPE, MAE, RMSE). Check this box if you want this additional statistical information on the forecast included in a new worksheet. |
| Timeline Range (7) | By default, the timeline range includes all dates in your table, but you can change it here. Note; the range must match the Values Range. |
| Values Range (8) | By default, the Values range includes all values in your table, but you can change it here. Note; the range must match the Timeline Range. |
| Fill Missing Points Using (9) | Excel uses interpolation to handle missing points, which means missing point will be completed as the weighted average of its neighboring points, where fewer than 30% of the points are missing. If you prefer, you can treat the missing points as zeros by selecting Zeros in the list. |
| Duplicate Aggregates Using (10) | Excel will average values that contain the same date/time. You can choose another calculation method, such as Median, from the list. |
Excel Forecast Sheet
The new Forecast sheet contains a Table and Chart. The bottom of the Table contains a series of FORECAST formulas (see colored boxes in image below):
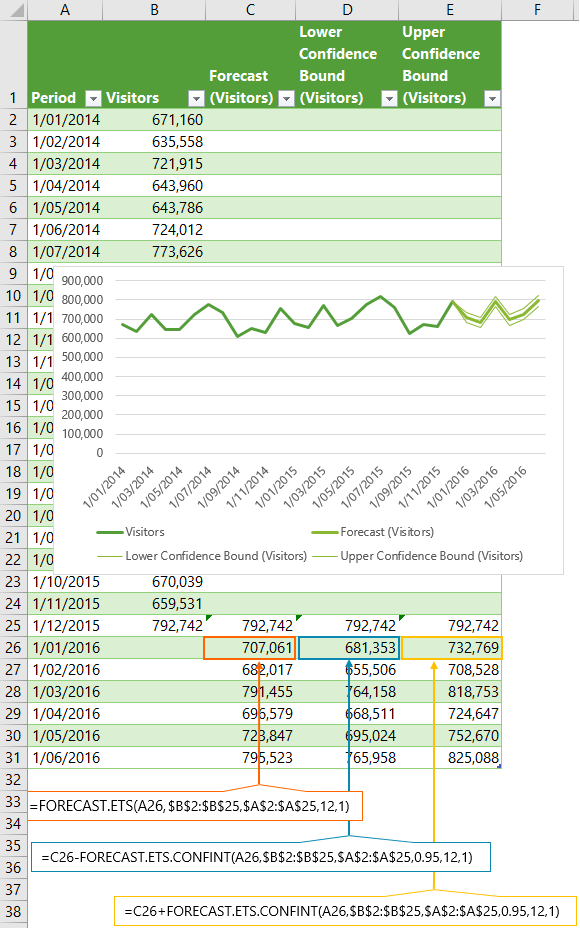
This is all created for you automatically.
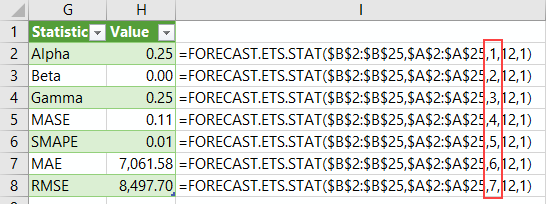
Forecast Statistics
If you choose to include the Forecast Statistics in the Options when creating the forecast sheet, Excel will include a table of different statistics, shown below, beside the forecast table.
They all use the FORECAST.ETS.STAT function as you can see in column I below, which displays the formula from column H. Notice that the 3rd argument is what specifies the statistic type:
Sharing Excel Forecast Sheets
You can share Excel workbooks containing forecast sheets and charts with users who have earlier versions of Excel. They will see the table and chart, but they can’t edit the formulas.
Modifying the Excel Forecast Sheet
So, you’ve created your forecast sheet and then you realise you want to change something.
Firstly, there is no link back to the original source data, so if you make changes to your source data you need to recreate the forecast sheet, or also edit the data in the forecast sheet table.
Also, there’s no way to re-open the ‘Create Forecast Worksheet’ dialog box and make changes to the Options and settings of the forecast. However, you can modify the FORECAST formulas directly in the Table.
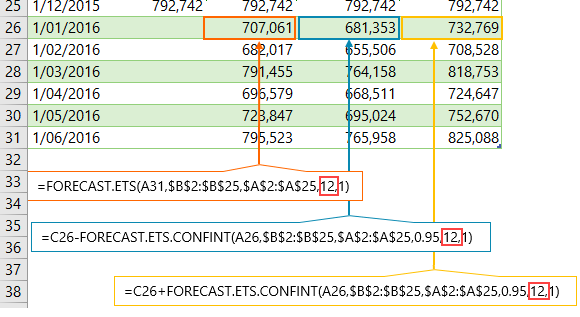
For example, if you want to change the seasonality, you’d edit the ‘seasonality’ argument in the forecast formulas. Taking the example below, we’d alter the 12:
You can also edit the ranges being referenced to tweak the forecast. For example, the data below is on a consistent upward trend, but you can see it then takes a dip in the first forecast period:
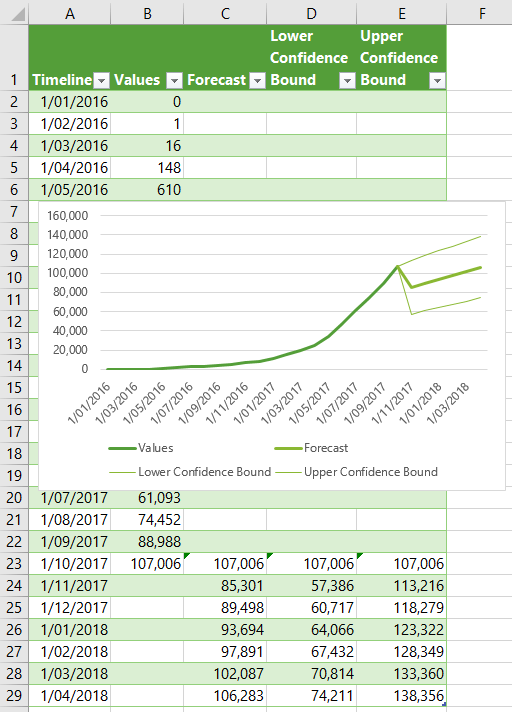
Maybe you’d prefer it continued the upward trajectory, in which case you could alter the timeline and values ranges to forecast based on more recent data:
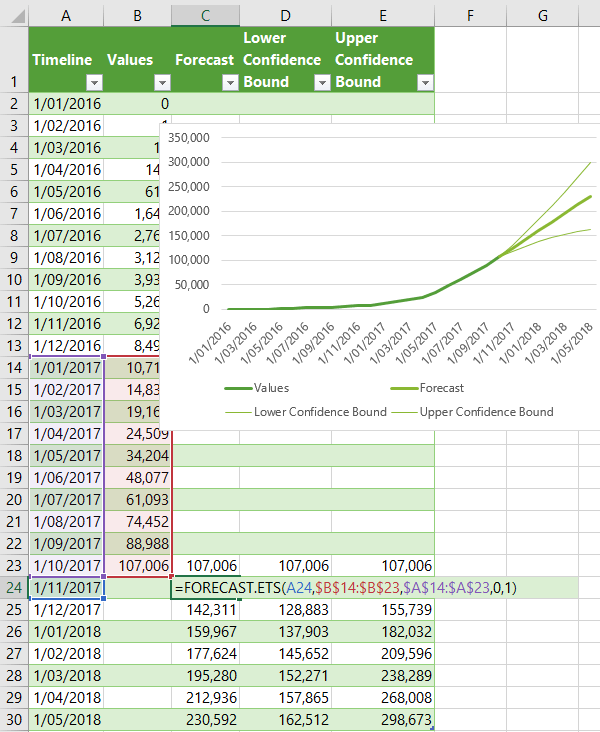
Don’t forget to also alter the confidence bound formulas in columns D and E.
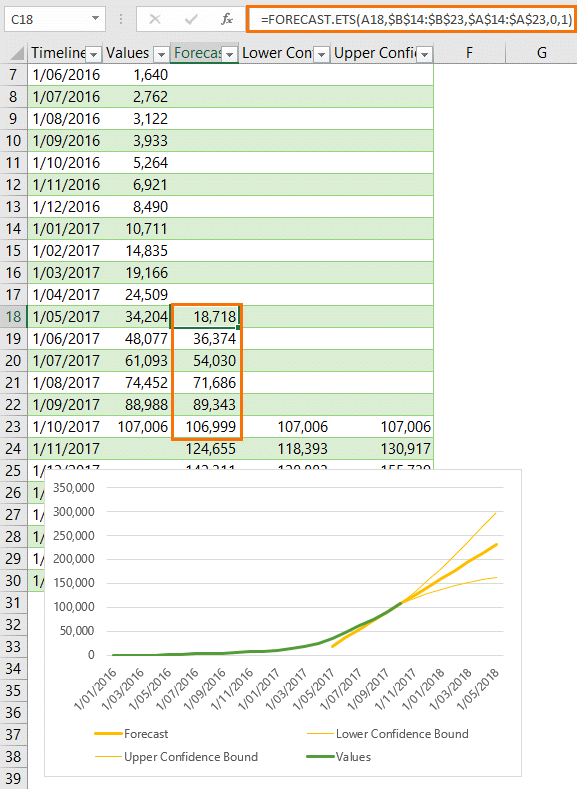
Forecast Accuracy
You can get a feel for how accurate the forecast is by starting it prior to the end of your actual data. In the example below I've copied the forecast formula back to row 18. You can see the yellow forecast line in the chart veers off track from May to July.
Functions Used in Forecast Sheet
The Forecast Sheet uses some of the new forecast functions available in Excel 2016, as follows:
Forecasted Values - FORECAST.ETS Function:
=FORECAST.ETS(target_date, values, timeline, [seasonality], [data_completion], [aggregation])
Confidence Interval – FORECAST.ETS.CONFINT Function:
=FORECAST.ETS.CONFINT(target_date, values, timeline, [confidence_level], [seasonality], [data_completion], [aggregation])
Forecast Stats – FORECAST.ETS.STAT Function:
=FORECAST.ETS.STAT(values, timeline, statistic_type, [seasonality], [data_completion], [aggregation])
They all contain similar arguments, which are described below:
Target_date - The next data point you want to forecast. This can be date/time or numeric
Values – The range of cells containing the historical values you’re basing your forecast on. This range must be the same size as the Timeline argument’s range.
Timeline - The range of cells containing the dates that relate to the historical ‘values’. The timeline values must have a consistent step between them and can’t be zero. The ranges of the timeline and values must be the same size, or Excel will return the #N/A error.
The timeline doesn’t need to be sorted, as Excel will sort it implicitly for calculations. If a constant step can't be identified in the timeline range, Excel will return the #NUM! error. If timeline contains duplicate values, Excel will return the #VALUE! error.
[Seasonality] – An optional numeric value. The default value of 1 means Excel detects seasonality automatically for the forecast and uses positive, whole numbers for the length of the seasonal pattern. 0 indicates no seasonality, meaning the prediction will be linear. Positive whole numbers will indicate to the algorithm to use patterns of this length as the seasonality. For any other value, Excel will return the #NUM! error.
Maximum supported seasonality is 8,760 (number of hours in a year). Any seasonality above that number will result in the #NUM! error.
[Confidence_level] - An optional numerical value greater than 0 and less than 1, indicating a confidence level for the calculated confidence interval. For example, for a 95% confidence interval, a 95% confidence level will be computed (95% of future points are to fall within this radius from prediction). The default value is 95%. If your confidence interval value is zero or less, or 1 or more, Excel will return the #NUM! error.
[Data completion] – This is an optional argument and although the timeline requires a constant step between data points, Excel supports up to 30% missing data, and will automatically adjust for it. 0 will indicate the algorithm to account for missing points as zeros. The default value of 1 will account for missing points by completing them to be the average of the neighboring points.
[Aggregation] - Optional argument. Although the timeline requires a constant step between data points, Excel will aggregate multiple points which have the same time stamp. The aggregation parameter is a numeric value indicating which method will be used to aggregate several values with the same time stamp. The default value of 0 will use AVERAGE, while other options are SUM, COUNT, COUNTA, MIN, MAX, MEDIAN.
Statistic_type – This is numeric value between 1 and 8, indicating which statistic will be returned for the calculated forecast. See table below for descriptions:
| statistic_type | Description |
| 1 | Alpha parameter of ETS algorithm - Returns the base value parameter—a higher value gives more weight to recent data points. |
| 2 | Beta parameter of ETS algorithm - Returns the trend value parameter—a higher value gives more weight to the recent trend. |
| 3 | Gamma parameter of ETS algorithm - Returns the seasonality value parameter—a higher value gives more weight to the recent seasonal period. |
| 4 | MASE metric - Returns the mean absolute scaled error metric—a measure of the accuracy of forecasts. |
| 5 | SMAPE metric - Returns the symmetric mean absolute percentage error metric—an accuracy measure based on percentage errors. |
| 6 | MAE metric - Measures the average magnitude of the errors in a set of predictions, without considering their direction. |
| 7 | RMSE metric - Returns the root mean squared error metric—a measure of the differences between predicted and observed values. |
| 8 | Step size detected - Returns the step size detected in the historical timeline. |
Tip: These new Forecast functions can also be used independently of the forecast sheet, just like regular functions.
Forecasting Pre Excel 2016
If you’re using Excel 2013 or earlier, you can create your own Forecast sheet manually using the FORECAST function (with some limitations).
For example, the chart below shows the result of the FORECAST function in the dashed line. You’ll notice it doesn’t take seasonality into account, this is the first limitation, as the FORECAST function uses linear regression and doesn’t have the ability to factor in seasonality.
The other limitation is that there’s no equivalent function to calculate the confidence intervals using exponential triple smoothing (ETS) that the new FORECAST.ETS.CONFINT function uses. The closest you’ll get is to use the CONFIDENCE.NORM function.
Please Share
If you liked this please click the buttons below to share.


I have daily overtime hours (M-F, but I’ve added Sat. & Sun. to make it spaced 1 day intervals) for a quarter and want to use the forecast sheet to project the next quarter. When I try to use the forecast sheet with this data I get the error message: “A forecast can’t be created because the timeline isn’t evenly spaced.” What am I doing wrong?
Hi Kendra,
Excel can handle up to 30% missing dates so not having Saturday and Sunday in your data set should be fine.
Are your dates actual dates or are they text ‘M’, ‘T’, ‘W’ etc.? Perhaps you could post your question and sample Excel file on our Forum so we can see the data you’re working with.
Mynda
Hi Mynda, thanks for the clear and complete explanation.
I noticed that the SMAPE metric and the MAE metric share the same description… is this correct?
Hi Fabio,
Well spotted. This definition is from Microsoft’s documentation on the FORECAST.ETS.STAT page, but I think you’re absolutely right, they should be different, albeit slightly.
MAE should read something more like: “Returns the symmetric mean absolute
percentageerror metric—an accuracy measure based onpercentageerrors.”I’ll edit the post above and let Microsoft know.
Cheers,
Mynda
How do you enter the custom format to wrap the date?
Hi Ted,
In the Format Cells dialog box use CTRL+J to force the format to wrap. You also need to format the cells with Wrap Text.
Thanks to Jon Peltier for that tip.
Mynda