
November 1, 2018
Excel Line Charts vs Dot Plot
A common chart mistake is to use a line chart for the wrong type of data. An example of that
Read More
November 1, 2018
A common chart mistake is to use a line chart for the wrong type of data. An example of that
Read MoreOctober 11, 2018
There are a couple of ways you can hide blanks in Excel PivotTables. To be clear, the ‘blanks’ I’m referring
Read More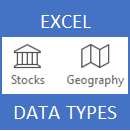
October 2, 2018
AI powered Excel Data Types will transform the way we work with Excel by enabling a cell to contain much
Read More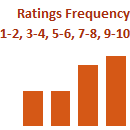
September 4, 2018
Excel Hash is an Excel competition dreamed up by fellow Excel MVP, Oz du Soleil. It’s based on the popular
Read More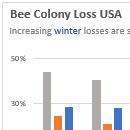
August 21, 2018
Excel Chart titles are often a wasted opportunity to connect with your audience and drive home your message. So, let’s
Read More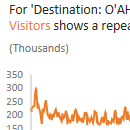
August 14, 2018
Understanding your data and creating Excel charts has never been easier with Excel's Analyze Data (previously known as Excel Ideas
Read More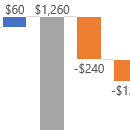
August 8, 2018
Excel Waterfall charts are now available to Office 365 users via the Insert > Charts menu. It makes light work
Read More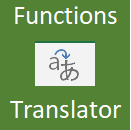
July 19, 2018
It’s often difficult enough to figure out the correct Excel functions to use, but it’s significantly harder if you also
Read More
June 25, 2018
Excel Slicers are great, but they’re a bit on the chunky side and that can be a pain when you’re
Read More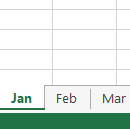
June 19, 2018
Splitting data over multiple sheets is perhaps one of the worst Excel crimes I see. It’s a crime because it
Read More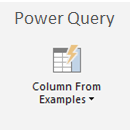
June 12, 2018
The Power Query Add Column from Example feature simplifies a task many of us perform daily. For example, how often
Read More
June 6, 2018
From time to time I get asked which Microsoft Office licence* should I get; Office 365 subscription, or the one-time
Read More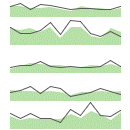
May 16, 2018
Excel mini charts are a great alternative to Sparklines. Mini charts are just regular charts made really small. You might
Read More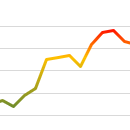
May 8, 2018
Excel multi-colored line charts are a little gimmicky, after all we don’t need color to tell if a line is
Read More
May 3, 2018
Excel 3D Maps in 2016, or Power Map as it’s known in Excel 2013, enable you to visualise data in,
Read More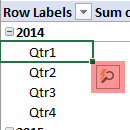
April 25, 2018
With PivotTable Quick Explore we can filter and drill down in PivotTables and Pivot Charts without the field list exposed.
Read More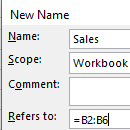
April 4, 2018
Excel Named Ranges is a vast topic that includes some simple techniques that we all can and should use to
Read More
March 22, 2018
The Excel ADDRESS Function returns a cell address for specified row and column coordinates. Optional arguments allow you to specify
Read More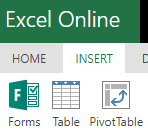
March 14, 2018
Inserting PivotTables in Excel Online is now possible. It’s still in its infancy with many features you may be used
Read More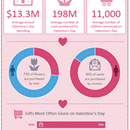
February 14, 2018
Excel infographics, like the one below, are easy to build and there are loads of tools you can use to
Read More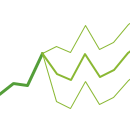
February 5, 2018
The Excel Forecast Sheet and charts are a new feature available in Excel 2016. In just a few clicks you
Read More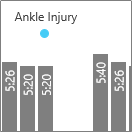
January 31, 2018
Plotting data over time can reveal patterns and trends, but often blips in the data require further explanation. We can
Read MoreDecember 14, 2017
Format your dashboards and reports fast with these pro Excel chart formatting tips. Watch the Video Pro Tip 1 –
Read More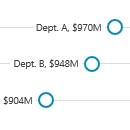
December 6, 2017
Dumbbells and Lollipop Charts Excel Dot Plots, dumbbells and lollipop charts are good for comparing one, two or three points
Read More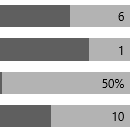
November 30, 2017
When you think of visualizing parts to a whole in Excel charts the first thing that’s likely to come to
Read More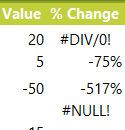
November 6, 2017
Obviously, we don’t want our PivotTables littered with #DIV/0! and #NULL! errors if we’re presenting them in a report (like
Read More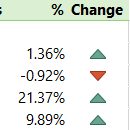
November 2, 2017
PivotTables can make quick work of summarising and analysing data and they have some handy built in percentage calculations available
Read More
October 25, 2017
We often need to extract the date or time portion from a date-time serial number for use in other functions.
Read More
October 25, 2017
The Excel DATE function combines separate year, month and day values and converts them into a date serial number formatted
Read More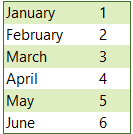
October 25, 2017
Often, we'll have a list of month names that we want to convert to a date, or even just convert
Read More