With the integration of Power Pivot into Excel 2013 (known as the Data Model), we now have access to a range of more advanced ‘Power’ tools right from within Excel.
One of these tools enables us to easily get the distinct count for a field in a PivotTable.
Note: Don’t worry if you don’t have Excel 2013 or 2016, or don’t have the Data Model (Power Pivot) in your version of Excel, I’ll show you a workaround you can use instead.
Download the workbook
Enter your email address below to download the sample workbook.
Excel PivotTable Distinct Count Example
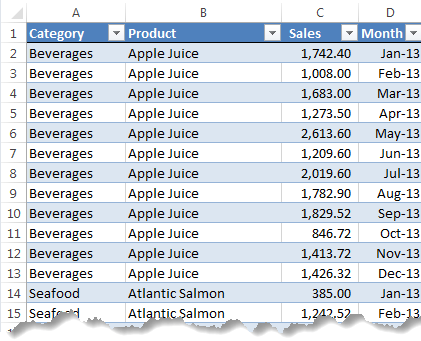
Let’s take the data below and say we want to know how many different products we have in each category, in other words, the distinct count of Products per Category.
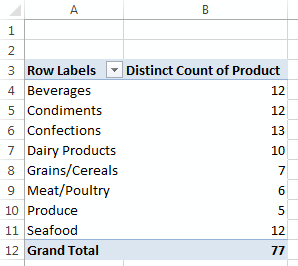
The end result will look like this:
Step 1: Insert a PivotTable and in the ‘Create PivotTable’ dialog box check the ‘Add this to the Data Model’ box:
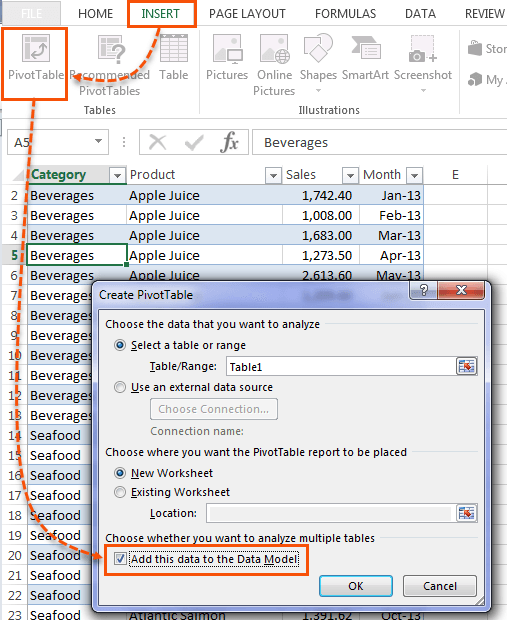
This adds the data to Power Pivot /the Data Model.
Note: If you don’t have this check box available it means your version of Excel doesn’t include Power Pivot, but don’t worry, remember I’m going to show you a workaround.
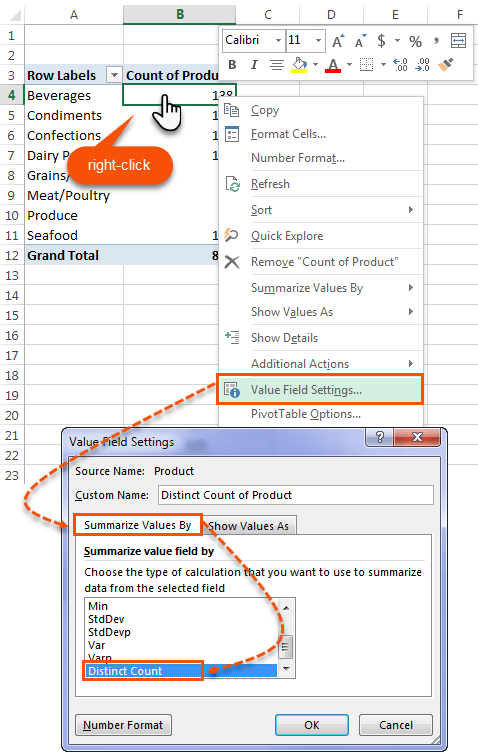
Step 2: Build the PivotTable placing the Product field (i.e. the field you want to count) in the Values area. This will return the count of the records/transactions for the products.
Then, to display the Distinct Count right-click the values column > Value Field Settings > Summarize Values By > Distinct Count:
Warning: If you have blank cells in the field you're counting they will also be included in the distinct count:
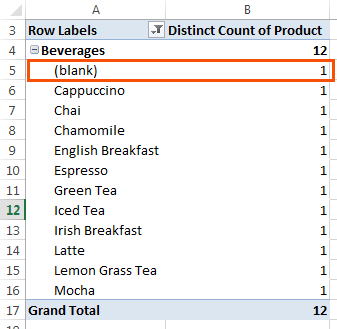
It makes sense since blank cells are also a distinct item in your list, but I can understand that it's not always desireable to include them.
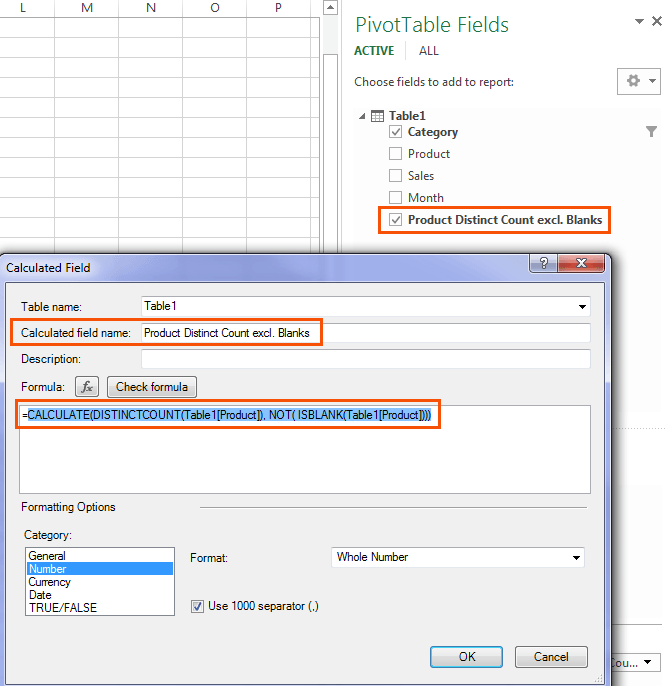
If you want to exclude blanks from your distinct count then you can either remove them from your source data, or write a Measure/Calculated Field using Power Pivot's DAX functions, like so:
=CALCULATE( DISTINCTCOUNT(Table1[Product]), NOT( ISBLANK(Table1[Product])))
This formula gets entered in the Power Pivot tab > Calculated Fields (Excel 2013) or Measures (Excel 2010 & 2016) dialog box.
It's then available in the PivotTable Fields List:
Thanks to Alex Klimson for raising this issue.
Don’t have the Data Model
If you don’t have the ‘Add this data to the Data Model’ check box available in your version of Excel, then you have two options depending on whether you’re using Excel 2007 or Excel 2010 as described in this post:
https://www.myonlinetraininghub.com/excel-pivottables-unique-count-3-ways
Want More Power
Power Pivot, or the Data Model (why it has two names is beyond me), has a load more cool features which enable you to go beyond the limitations of regular PivotTables.
To get a better understanding of what Power Pivot can do for you, or if you’d like to learn Power Pivot, please take a moment to check out my Power Pivot course.
Tip: Don’t attempt Power Pivot unless you are already proficient with PivotTables. Click here to check out our PivotTable course.


Hi – I tried this but the column I am trying to distinct count is derived from an IF formula, where the false returns “”. This is not considered a BLANK for the purposes of eliminating through the additional calculate(distinctcount(XXX),not(isblank(XXX))) method, so its still returning multiples where it should be single values. how can i either get my IF formula to return a truly blank cell OR write the power pivot formula differently?
Hi Teresa,
There are a few ways to tackle this, but I would probably use Power Query to perform the task of the IF formula, then load the data to the Power Pivot data model to perform the distinct count.
Mynda
Hi i am using Microsoft excel 2013 and i am using distinct count… how to exclude blank cells value from distinct count in pivot table ?
You will need to write a DAX measure for this. For example, to ignore blank products your formula would be:
=CALCULATE( DISTINCTCOUNT(Table1[Product]), Table1[Product] BLANK())
I receive “Calculation error in measure ‘Range'[Calculated field 1]: A function ‘CALCULATE’ has been used in a True/False expression that is used as a table filter expression. This is not allowed.” when I use the function for blanks not to be counted. Am I doing something wrong?
Hi Alice, Please post your question on our Excel forum where you can also upload a sample file or screenshots and we can help you further.
Hi. Could anyone please help on this topic where i have added 15 pivots already without ticking the option “add this to data model” while making the pivots, however now i need a distinct count and that is possible through ticking it before making the pivot.
How can i go back and tick this option to get the distinct count option on all 15 pivots? I cannot redo all the pivots since its too tedious
Hi Sarah,
You can go to your source data > Insert tab > PivotTable and check the ‘add to data model’ option. However I recommend you create them again otherwise you will have the data in your Excel file 3 times:
– Once in the worksheet i.e. the source data
– Once in the regular PivotTable pivot cache
– and once in the Power Pivot/Data Model.
Also, if you have some PivotTables connected to the Data Model and others connected to the Pivot cache then you can’t use Slicers to control those different PivotTables.
Mynda
Thank you for this tutorial. I just discovered your website and it is amazing how and why I hadn’t heard of you before. Now you are saved in my favorites and anywhere I can save you on my devices.
I used the PowerPivot distinct count however, my data consist of 2016 and 2017 products which means there are duplicate product names. But distinct recognizes only 1 and counts only 1 for both dates. any work around to this?
Hi KC,
If you want to see the distinct count at a year level then you need to add the Year field to your PivotTable rows/columns area so that Excel knows you want the distinct count by product within each year.
If you’re still stuck please post your question in our Excel forum with a sample Excel file so we can help you further.
Mynda
Hi Mynda,
Thank you for this post.
I believe the case when your data has BLANK cells deserves special attention. What surprised me is that the blank cells are also counted. For example, when your column has {1, 2, (blank)} entries DISTINCTCOUNT returns 3, while COUNT—just 2. I wish Microsoft made a provision to exclude blank cells in distinct counting. So, beware of traps.
Hi Alex,
Distinct Count counts the different types of values in a field. If you have blank cells then this is also a type of value, albeit a blank, and therefore it is included in the distinct count.
Mynda
I think Pivot Tables are not for me. I receive quotations from 2-3 different suppliers around the world with sometimes hundreds of items included. All items have a different description, different part number, different substitute part number, quantity (some time same), different Price and different totals. How can I benefit from Pivot Tables.
Furthermore, I receive price of different flight checks from different companies, or price for various trainings from different companies. I tried Pivot Tables but no results to my usage.
Can you advise how can I benefit from Pivot Tables?
Hi Gulraiz,
It depends what you want to achieve. PivotTables may not be the right tool for the job.
If you have data in multiple tables with different codes, descriptions etc. for the same items, then that is a data problem. You need to create some form of mapping table that maps the different codes etc. from each supplier into one common code so you can then compare apples with apples.
You would have to build that mapping table yourself. There’s no automated tool to do that for you.
Mynda