
January 16, 2024
Excel + ChatGPT Integration to Solve Any Problem
No matter whether you're an Excel newbie or an expert, be prepared to revolutionize how you work in Excel with
Read More
January 16, 2024
No matter whether you're an Excel newbie or an expert, be prepared to revolutionize how you work in Excel with
Read More
January 9, 2024
The GROUPBY and PIVOTBY functions are a significant breakthrough in Excel's toolbox of functions. They let you easily group or
Read More
January 2, 2024
With the cost-of-living crisis affecting everyone, it's essential to get control of your finances. Having a personal budget can be
Read More
December 19, 2023
Imagine having a tool that transforms the way you work, a tool so powerful it's valued at a minimum of
Read More
December 12, 2023
With AI gradually making its way into every aspect of our lives, working in Excel has become much easier. You
Read More
December 4, 2023
New in October 2023, Microsoft introduced Excel checkboxes embedded directly within cells*. This enhancement is set to streamline data interaction
Read More
November 28, 2023
We now have a new, improved way to import data from the web to Excel. Just like in Power BI,
Read More
November 20, 2023
Slicers enable you to quickly and easily toggle filters on and off. They're best known for working with PivotTables, but
Read More
November 7, 2023
Descriptive statistics enable you to summarize, organize, and simplify large datasets to derive meaningful patterns and insights. For a long
Read More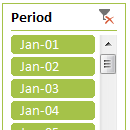
October 31, 2023
Slicers are a fantastic tool to get a filtered view of your data and visuals. But by default, they get
Read More
October 3, 2023
The SUMPRODUCT function is one of Excel's most versatile functions. But now that we have SUMIFS, COUNTIFS, AVERAGEIFS etc. it’s
Read More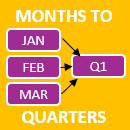
September 26, 2023
Back in my accounting days I regularly prepared reports that summarized monthly data into quarters. Back then, we used the
Read More
September 17, 2023
Excel BYCOL and BYROW functions fundamentally change the way we write formulas that calculate across columns and down rows. They
Read More
September 5, 2023
Excel has a load of AI tools already built-in that we can use to improve productivity and make our lives
Read More
August 25, 2023
One of the best uses for Python in Excel is creating the amazing charts available through Python libraries like Seaborn
Read More
August 22, 2023
You can now use Python in Excel natively! Python runs securely in the cloud, and we write Python in Excel
Read More
August 15, 2023
Excel dynamic named ranges bring flexibility and efficiency to your spreadsheets. Unlike static named ranges, dynamic named ranges automatically adjust
Read More
August 8, 2023
Excel functions are the backbone of a financial modeler’s day to day work and as such, it’s essential to have
Read More
August 1, 2023
Progress charts are a powerful way to track milestones and showcase achievements. However, there’s no built-in way to create Excel
Read More
July 25, 2023
Excel Office Scripts: The Future of Automation, Replacing VBA Excel Office Scripts have ushered in a new era of automation,
Read More
July 18, 2023
Efficiencies gained from Power Query can be life changing. I’m not exaggerating. Power Query can reduce time spent gathering and
Read More
July 13, 2023
Everything you need to know about how Excel handles date and time and all the tools you will need. Read
Read More
July 11, 2023
Charts provide a visual representation of data, making it easier to understand and interpret large amounts of information quickly. At
Read More
July 6, 2023
One of the downsides of PivotTables is they have a very distinctive look. Some might even say they’re ugly. In
Read More
June 27, 2023
With Microsoft 365 we can now include images in Excel PivotTables, as well as built in data types like Stock
Read More
June 20, 2023
Annoyingly, there’s a shortcut for Merge & Center on the Ribbon, but nothing for Center Across Selection which is far
Read More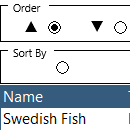
June 13, 2023
Dashboards have limited space which is why an Excel scroll and sort table is super handy. Scroll and sort tables
Read More
June 6, 2023
Excel Formatting Best Practices Proper use of Excel formatting can significantly impact the speed and clarity in which users can
Read More
May 30, 2023
Excel can now write formulas for you. Simply give it an example or two and it’ll suggest a formula to
Read More
May 9, 2023
Excel linear regression is easy with the built-in tools. In this tutorial, we'll explore what linear regression is, why it's
Read More