Some might say that Excel CUBE functions are the new PivotTables because they allow us to build reports based on Power Pivot models in a more free-form fashion, whereas PivotTables are quite restrictive in their layout and their cells cannot be edited.
And just like PivotTables, we can use Slicers to filter CUBE functions for fully interactive reports and dashboards.
Watch the Video

Download Workbook
Enter your email address below to download the sample workbook.
Writing Excel CUBE Functions
When you’re starting out with CUBE functions, you’ll find it easier to automatically generate CUBE formulas by converting an existing PivotTable like the one below containing sales by category and sub-category for each month.
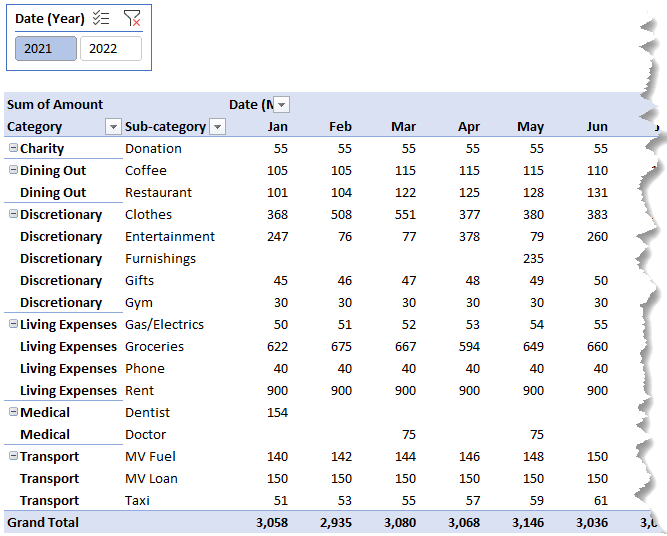
It’s a good idea to set the layout in a Tabular Form so you don’t have redundant headings once you make the conversion.
To convert a PivotTable, select any cell in the PivotTable > then on the PivotTable Tools: Analyze tab > OLAP tools > Convert to Formulas.
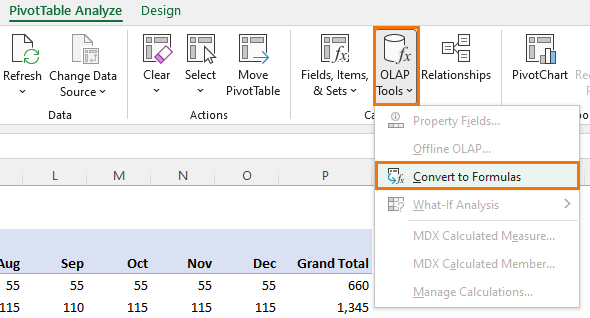
Note: If you have fields in the Filters area, then you’ll be prompted to choose to either also convert them or keep them so you can still filter the data. I prefer to use a Slicer for the filtering, so I don’t have any filters on this PivotTable.
This conversion permanently replaces the PivotTable with CUBE formulas.
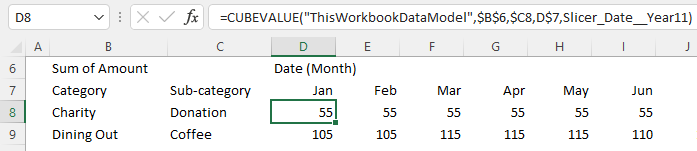
In the formula bar you can see the values have been replaced with CUBEVAUE formulas:
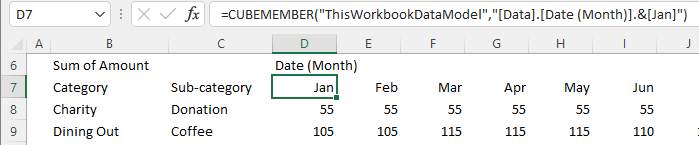
And the row and column labels have been replaced with CUBEMEMBER formulas:
CUBEVALUE Function
Looking at the CUBEVALUE formulas more closely you can see the first argument is the connection, this is your data model for the workbook, which will always be called ‘ThisWorkbookDataModel’, and then we have a series of member_expression arguments which essentially filter the data.
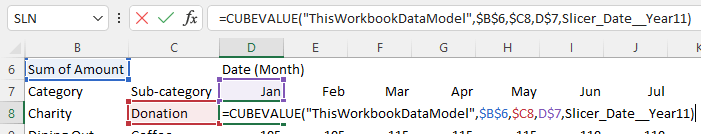
Member expressions can be other cube functions that evaluate to a set of members or a single member in your model, or they can reference other cells that contain these cube formulas or member values, as we can see with the formula above.
To be clear; Members can be the fields, items, measures, or Slicers in your model.
In the formula above the member expressions are the measure; Sum of Amount, the Sub-category in the row label, the month in the column label and the Slicer for the year.
The Slicer name is entered when the CUBE formulas are cretaed. However, if you need to find the Slicer name, you can right-click and view it in the Slicer Settings. It’s the ‘Name to use in formulas’.
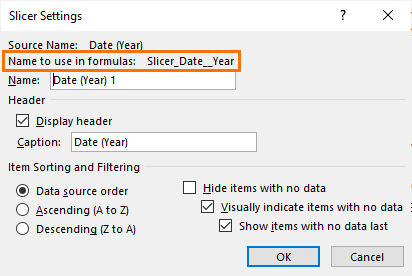
Tip: You can change the Slicer name via the Name Manager if you want.
CUBEMEMBER Function
The row and column label cells contain CUBEMEMBER formulas:
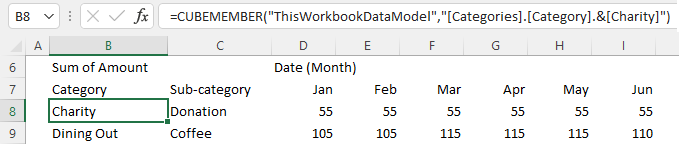
Notice CUBEMEMBER also requires the connection for the first argument, and then it references the Categories table to get the Category, Charity. These items are hard coded, which is not ideal, and we’ll look at how we can automate this in a moment, but first I want to point out the Grand Total CUBEMEMBER formula below:
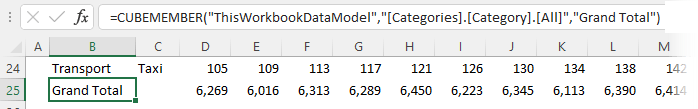
Here, instead of a hard coded category name, we have [All], which essentially says to include all of the categories in this CUBEMEMBER. Because this formula returns all category names, we can use the last argument for the caption to tell the formula to display ‘Grand Total’ in the cell. You can change it to display something else if you want.
Now that we’ve converted our PivotTable to cube formulas we can cut and paste them to other locations in our workbook, keeping in mind the cells they reference. And just like any other formula, you can perform further math calculations with them.
Making CUBE Functions Portable
Another option is to nest the CUBEMEMBER values inside the CUBEVALUE formulas to make them more portable.
For example, you could simply copy the CUBEMEMBER formula arguments after “ThisWorkbookDataModel” from the cells the CUBEVALUE formula is referencing creating one big formula like so:
=CUBEVALUE("ThisWorkbookDataModel",
"[Measures].[Sum of Amount]",
"[Categories].[Category].&[Charity]",
"[Data].[Sub-category].&[Donation]",
"[Data].[Date (Month)].&[Jan]",
Slicer_Date__Year)
Now that this cube formula is directly referencing the model, I’m free to move it anywhere in this workbook as it’s no longer dependent on any other cells. The other benefit is this formula is easy to read because all elements are explicitly listed.
Making CUBE Formulas Dynamic
If you’re writing formulas from scratch, it’s a lot of work to create each formula with the category, sub-category and month hard keyed.
Instead, we can make the formulas dynamic by referencing cells containing text values for the row and column labels and even the measure. That is, you don’t have to reference CUBEMEMBER formulas in your CUBEVALUE formulas. This means I can write one formula and then copy and paste them to the cells in the table, which is a super-fast way to write your CUBE formulas and build your reports.
And with all these formulas, I can still use the Slicer to filter the table!
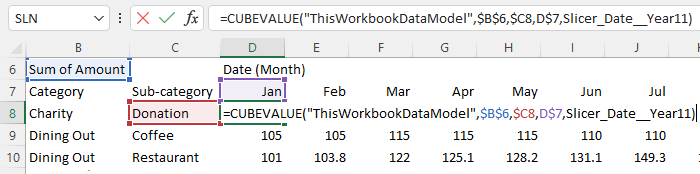
CAUTION: This technique is ok for simple models, like the in this example, however if you’re working with models that have these items listed in multiple tables, it’s better to fully qualify the row and column labels to avoid ambiguous results, like so:
=CUBEVALUE("ThisWorkbookDataModel", $B$6,
"[Data].[Sub-category].["&$C8&"]",
"[Data].[Date (Month)].&["&D$7&"]",
Slicer_Date__Year11)
More CUBE Functions
If you’d like to learn more CUBE functions and Power Pivot, please consider my Power Pivot and DAX course.

Hello Mynda,
Thank you for the great video and clear instructions. I was trying to follow along with my own data set that was built in Power BI and exported to analyze in Excel. I added some shops to the columns and their sales to the values but when I use the OLAP tool to convert to formulas I keep getting this error.
“Fields in the Values area prevent conversion to formulas because they are defined in Excel, not on the server or service. To remove fields from the Values area and retry converting to formulas, select OK.”
I don’t understand why it keeps throwing this error when it was built on the service. Do you know how to fix this?
thanks
I’d say it has something to do with this “I added some shops to the columns and their sales to the values”.
Well this was nice, with a nasty sting in the tail for me at least
=CUBEVALUE(“ThisWorkbookDataModel”,CUBEMEMBER(“ThisWorkbookDataModel”,”[Measures].[“&”Sum of Amount”&”]”))
returns 68,566
So I thought I could generalize with Count, Count Distinct and apply to other fields, without going through the pivot table route, given that the data is already in the data model. But the following all return #N/A:
=CUBEVALUE(“ThisWorkbookDataModel”,CUBEMEMBER(“ThisWorkbookDataModel”,”[Measures].[“&”Count of Amount”&”]”))
=CUBEVALUE(“ThisWorkbookDataModel”,CUBEMEMBER(“ThisWorkbookDataModel”,”[Measures].[“&”Count of Sub-category”&”]”))
=CUBEVALUE(“ThisWorkbookDataModel”,CUBEMEMBER(“ThisWorkbookDataModel”,”[Measures].[“&”Count Distinct of Sub-category”&”]”))
The technique would be incredibly useful as a quick investigation of data within data models if the above worked.
Hi Andrew,
Those measures are implicit. You need to create a PivotTable with those implicit measures before the CUBE functions can see them in the model. You can then delete the PivotTable. Alternatively, and better is to write the measures explicitly in the model and then reference them with the CUBE functions.
Mynda
Hi Mynda,
How do you add a slicer to the CUBEVALUE formulas for a field that is in a linked table in the data model? In your file for example how would I add the Category as a slicer in to the formula? I can add sub-category but get #VALUE!.
Insert the Slicer, then right-click and edit the properties to get the Slicer formula name. Insert this in one of the member expression arguments, as you can see in my example.
Hi Mynda,
That works fine for any field that is in the Data table but not if the field is in the Categories table even though they are linked in the Data Model. As mentioned I tried it with the Category field. The slicer formula name is “Slicer_Category” but if you add this in to the formulas it gives #VALUE!.
I suspect you have conflicting filter context. If you use this formula based on my file references it works:
=CUBEVALUE("ThisWorkbookDataModel",$B$5,P$6,Slicer_Date__Year1, Slicer_Category)Mynda
Hi Mynda,
Thanks for all you do and all the fantastic info you post/share. Sorry if this is a “newb” question, but how to you get the “OLAP tools” button to show and not just be grayed-out? I tried to convert a pivot table I had previously created and couldn’t. When I web-searched for an answer all the answers that came up said that this tool was only for pivot tables which were connected to an OLAP source (i.e. an external SQL source). It this true, and if not, how can I use this tool for my pivot table?
Thanks for your patience. Cheers, Tom.
Hi Tom, the OLAP tools are only available for Power Pivot PivotTables. As shown in the video at the start, you have to check the ‘add to data model’ button when creating your PivotTable for this to work. Hope that clarifies things.
I have Excel 2013 and, in my pivot table, Analyze tools setting OLAP function is grayed out. How do I enable it? Your article does not say anything about this issue.
Thanks
Hi Ashok, you need to load your data to Power Pivot for the OLAP tools to be available. Not all versions of Excel 2013 have Power Pivot. You can check the list of versions that do and don’t have Power Pivot here.
Another excellent video, Mynda. thank you. I am puzzled by the case where there are imbedded spaces in the member-name. In your workbook, I pointed a CUBEVALUE function to “Dining Out” in column B.
If you paste-values the CUBEMEMBER function as text, the CUBEVALUE function works fine. If you type in the text or, after pasting, edit it in anyway (delete a letter then put it back in), the CUBEVALUE returns #N/A. Wrapping the text in square brackets solves the problem but looks ugly. Strange.
Interesting find, Philip. I haven’t been able to replicate this glitch on my PC.
I did a Data. Refresh All after the edit. Same result on “Sum of Amount”. All CUBEVALUE functions returned #N/A.
Refresh All worked fine for me. Very strange. If you want to email me your file I can take a look.
Thank you Mynda. I have replied (with file attached) to the newsletter email address.
Whilst we are all trying to promote cool tips and tricks regarding Excel (and you do this better than most), I think we need to give balanced and honest feedback re the downsides of using certain functions and the CUBE functions DEFINITELY fit into this category. I saw this “old and scarcely used for a good reason” function trotted out again at the London Excel User Group in December. People lost their minds through excitement and I am thinking :
i) Doesn’t scale at all (architecturally when used against SSAS Tabular or MD Cubes) at worst it performs one query PER CELL. You can guess how efficient this is ! There is an obvious reason why it says “getting data” in each CUBE function cell on certain reports.
ii) It is very hard to maintain. Yes, convert to formulas is lovely on a new report / web demo and you simply cut and paste formulas as required. You now add 10 nominals to the GL next month and want to insert these into the report ? Uh, not so easy. Nothing can be data driven, so you’d better check EVERY CUBE function report EVERY month / period, as you’d better hope the data source doesn’t change !
So if you get excited by the CUBE functionality, my advice is test WITHOUT rolling out and see if it performs as expected. Then and ONLY then inform your users.
Thanks for sharing your experiences, Paul! I agree, they have their downsides and are better suited to models that are more static in their structure. I like them for pulling in a few values here and there that don’t warrant a bulky PivotTable.
In consulting roles, each project has different data. Projects often have a short duration (typically less than 4 weeks), with an expectation of delivering a solid first analysis within 1-2 days after receiving the source data (usually monthly trial balances). While more technically efficient alternatives exist, the reality is that many users lack the knowledge of more advanced functions or are simply constrained by tight deadlines. Consequently, the predominant alternative to CUBE functions remains SUMIFS due to its simplicity. That said, compared to SUMIFS, CUBE functions do offer several advantages. Just to put things into perspective.
Thanks for sharing your experience, David. The difference with CUBE functions is that they can reference the data model (Power Pivot), which SUMIFS can’t.