I'm going to look at situations that appear to be fairly common: loading data into Power Query where the source data has columns with different names.
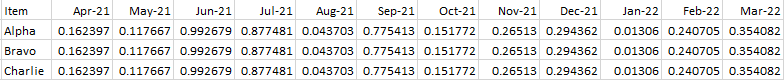
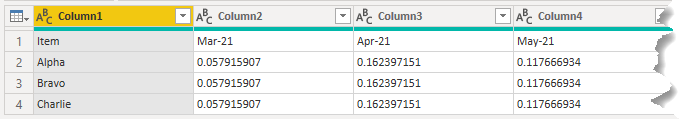
For example, in the following file received in August 2021, I have data that relates to various items over a 12 month period.

What the data is showing is values for the items for the month the file was created (Aug 21), the following 6 months (Sep 21 to Feb 22) and the preceding 5 months (Mar 21 to Jul 21)
Watch the Video

Download Power BI File
Enter your email address below to download the sample workbook.
This Works In Power BI and in Excel
The issues shown here and the solutions can be used in Power Query in both Power BI and Excel. I am using Power BI in my example.
Each month I get a new file showing values for that month, the next 6 months and the preceding 5.
So for Sep 21 the file looks like this
It contains data for the months Apr 21 to Mar 22. It still contains 12 months of data, but it's moved along by 1 month compared to the previous month's file.
Clearly each file has the same number of columns and whilst some of those columns have the same names, the order of those columns changes every month.
If I load these files into PQ and combine them let's see what I get.
In Power BI Desktop, I load data from a folder: Get data -> More -> Folder
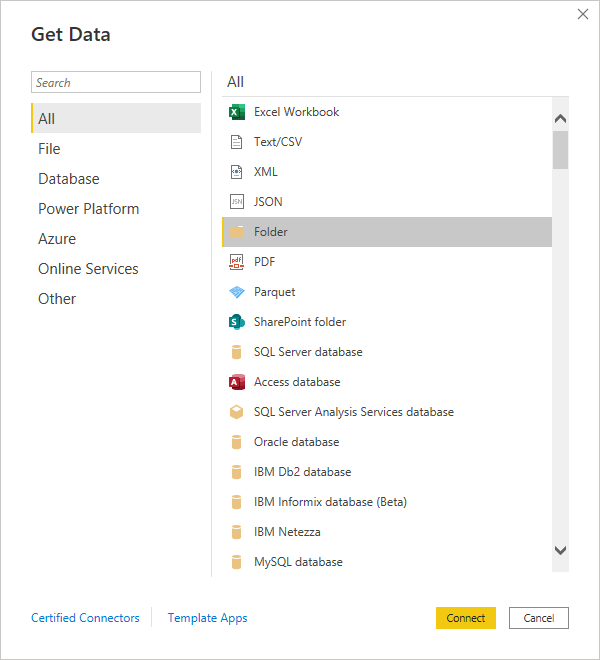
After browsing to the folder containing the CSV files, and selecting it, I choose to Combine & Transform the files.
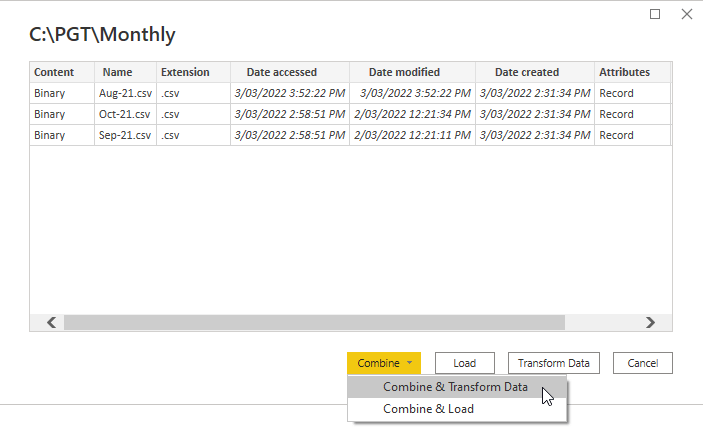
In the data preview I accept the defaults and click OK.
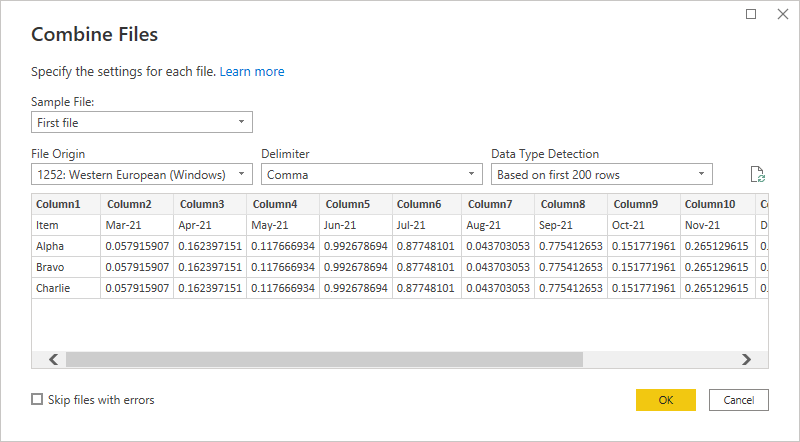
The result of combining the files is this
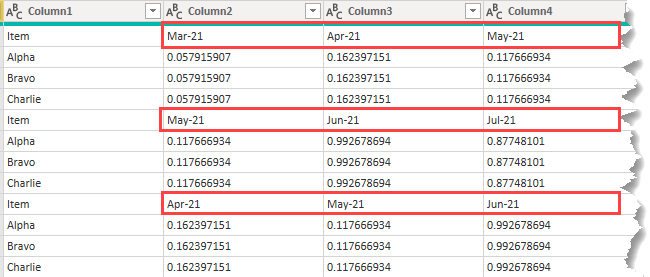
It's not exactly what I want. For a start the columns contain the Month-Year names and these aren't consistent down the columns because for each new file, the months shift along by one.
What I want is a column for the item and a column for the months (dates) and a column for the numeric values. How to achieve this?
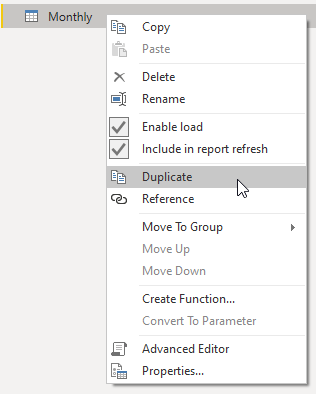
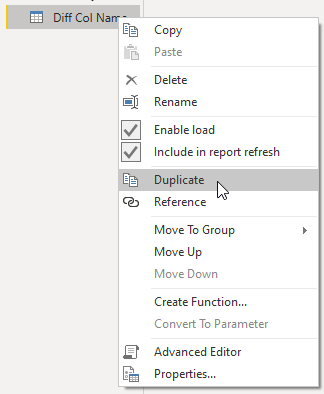
The first thing I'll do is duplicate this query so I can play around with it a little and investigate how to solve this problem.
With this done, I'm going to back up a bit and delete the last 2 steps
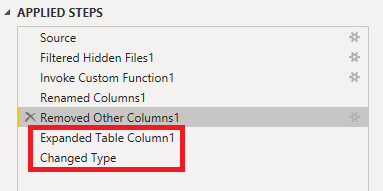
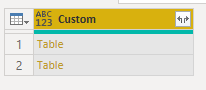
This leaves me at the point in the query where I have the 3 CSV files as Tables in one of my columns.
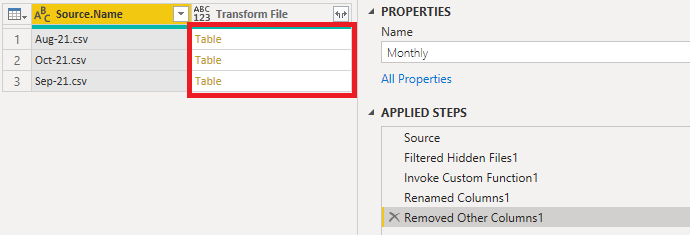
Clicking on the first table (Aug 21) shows the data in that file
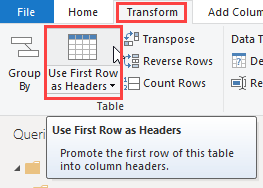
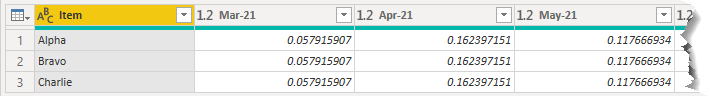
Promoting the first row to column headers is the thing to do here
Which does this
To get all the months/dates into a column and all the values into another column, I can select the Item column and then Unpivot Other Columns
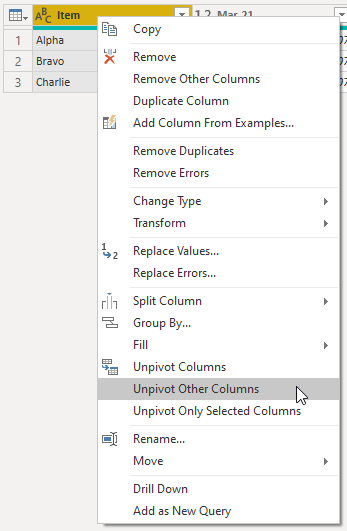
This gives me the data from this file in a format that I can use so I need to apply these transformations to all the files.
Back in my main query where I left it with just the files as tables in a column
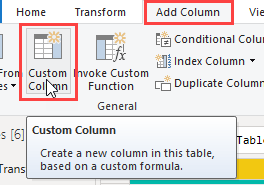
Add a Custom Column
Using the Table.PromoteHeaders function I can manipulate each of the tables inside the Transform File column using this code
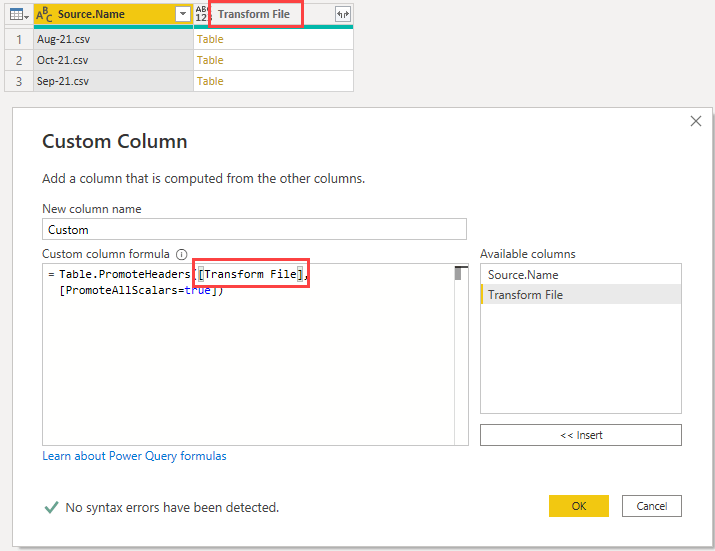
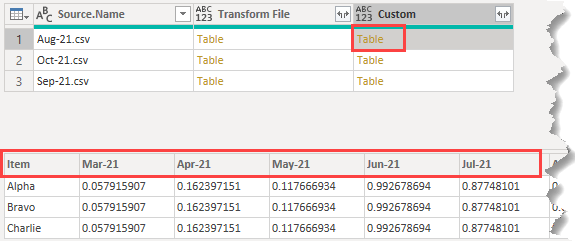
Clicking in the cell beside the August-21 table shows me that the first row has been promoted to headers, and it is the same for all 3 tables.
Next I need to unpivot the dates/values. Add another Custom Column and enter this code
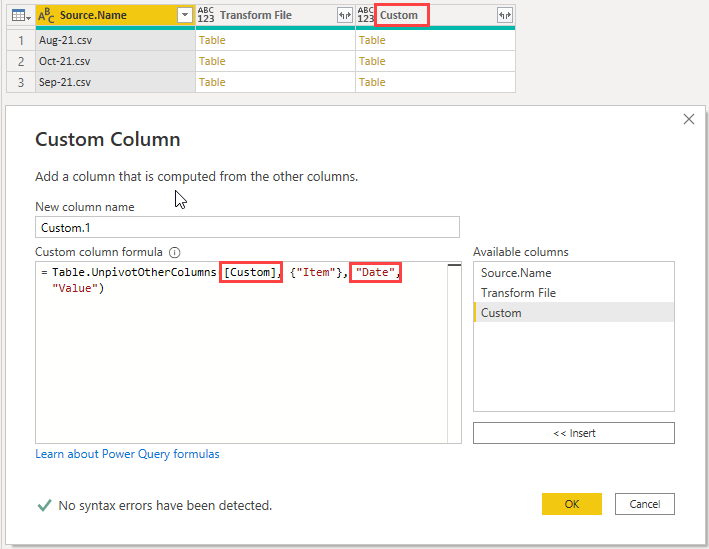
Note that I am referring to the Custom column as the location for the tables, and that I am naming the first column created by the unpivot Date
I get another column containing tables with the dates and values unpivoted into their own columns
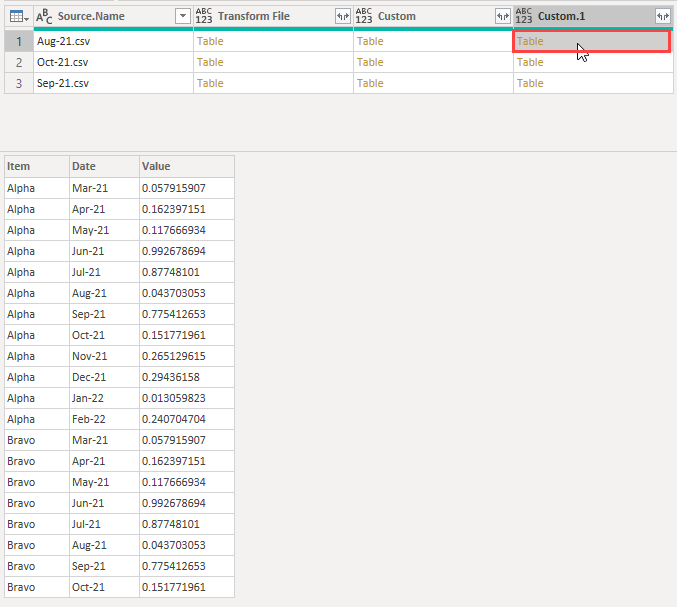
Almost done. Next delete the first 3 columns leaving me with just the Custom.1 column.
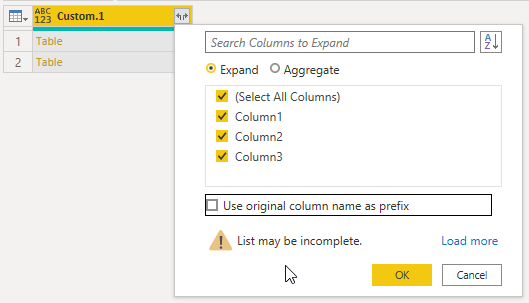
I can expand the tables in this column now. Uncheck Use original column name as prefix
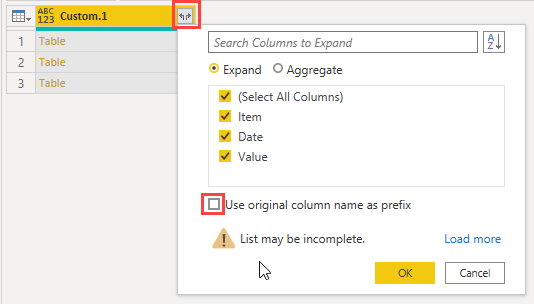
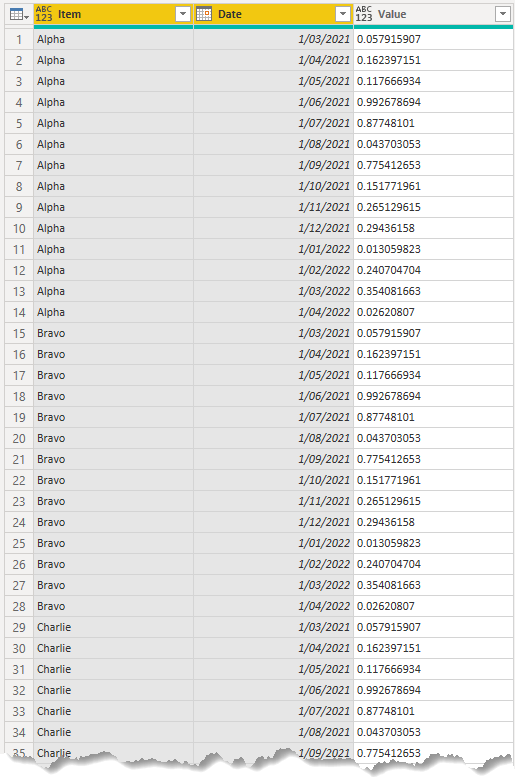
Giving me this
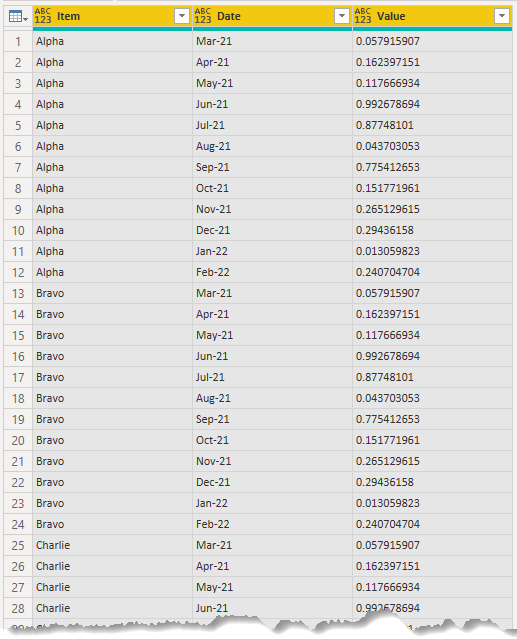
There's one more thing to do. Remember that each month I get data for another month, so I'm going to end up with a lot of duplicate values for months that are contained in several files.
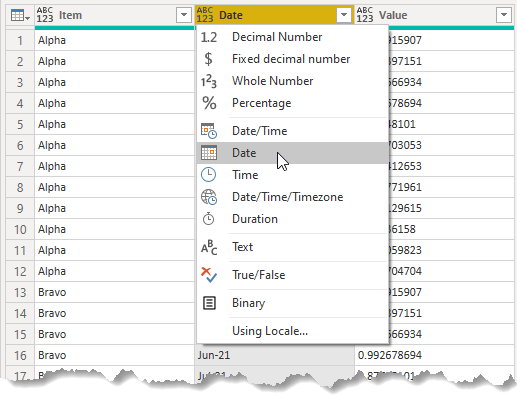
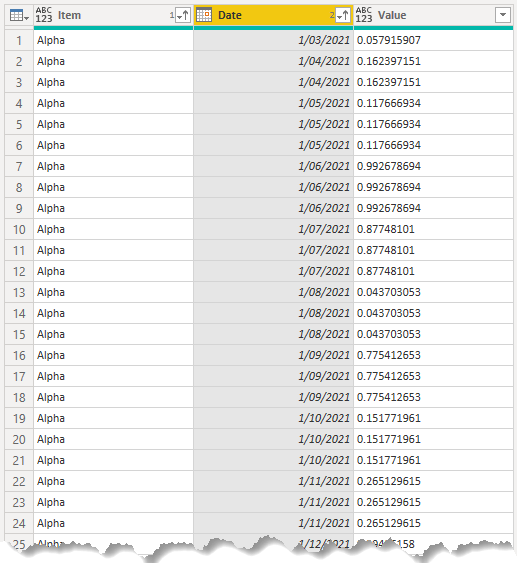
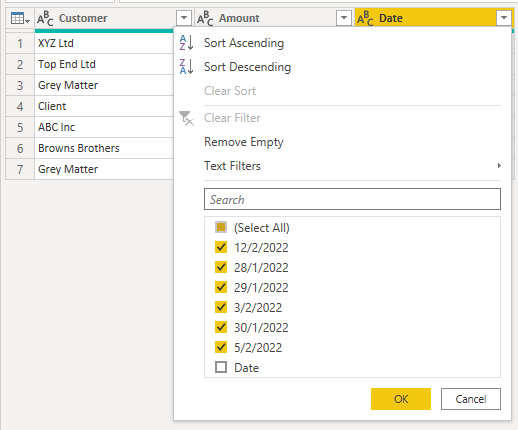
To see this, first change the Date column to the Date type
Next sort the Item column in ascending order, then sort the Date column in ascending order.
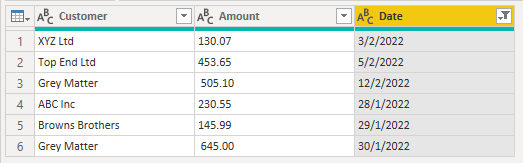
It's plain to see now that there are duplicate values
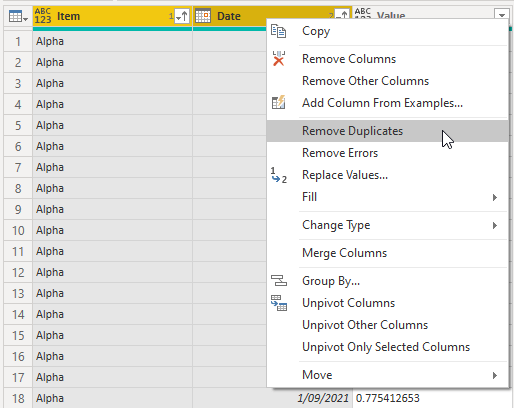
To fix this, click on the Item column then click on the Date column, then right click on either column and choose Remove Duplicates.
Different Column Names - Same Data : 4 solutions
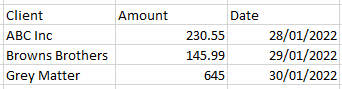
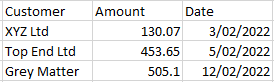
In this scenario I'm receiving data about clients and the values represent the amount I'm charging for some work done, on the dates shown.
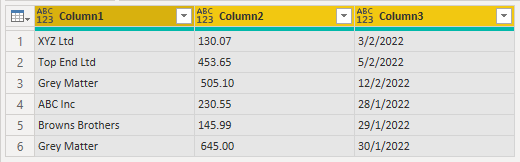
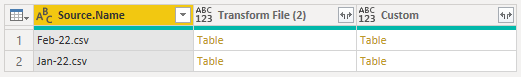
In the first CSV file, for January, you can see there are 3 columns, the first one named Client.
In the February file there are also 3 columns but the first is named Customer.
If I load these files with Power Query (using the same process as in the first example) I get this.
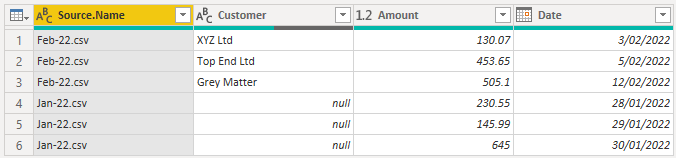
I get nulls in the first column because in the Feb CSV file that column is called Customer, and in Jan it's called Client. The Feb file has been loaded first so the first column takes its name from that file. As the Jan file does not have a Customer column, Power Query enters nulls here, and doesn't know what to do with the data in Jan's Client column so omits that entirely.
I have 4 solutions to this problem for you.
Solution 1
Let's back up a bit and get rid of these steps.
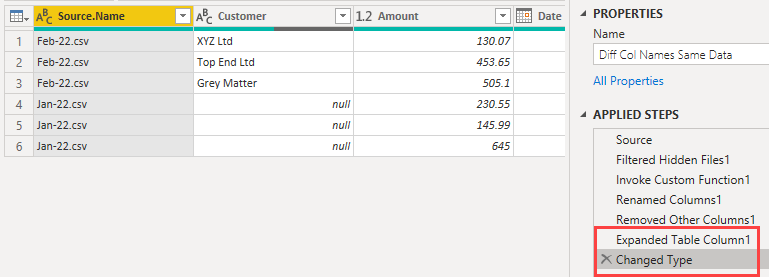
I want to be left with the source CSV files as tables in a column.
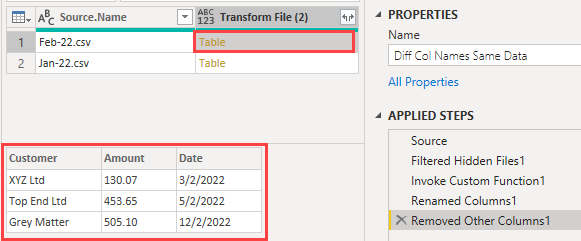
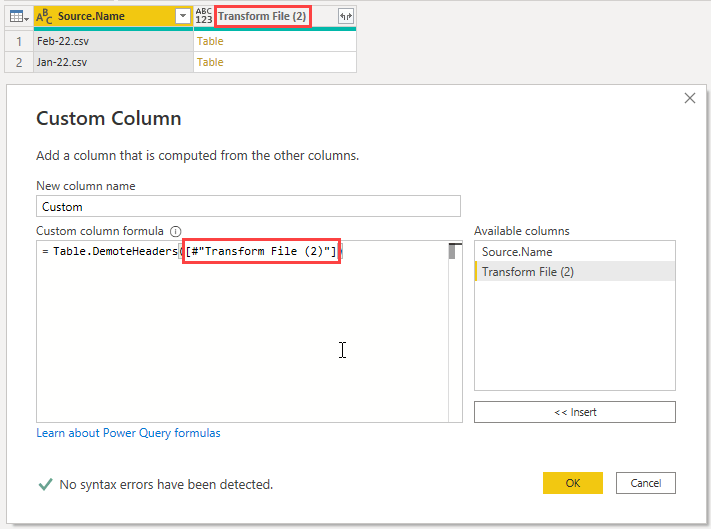
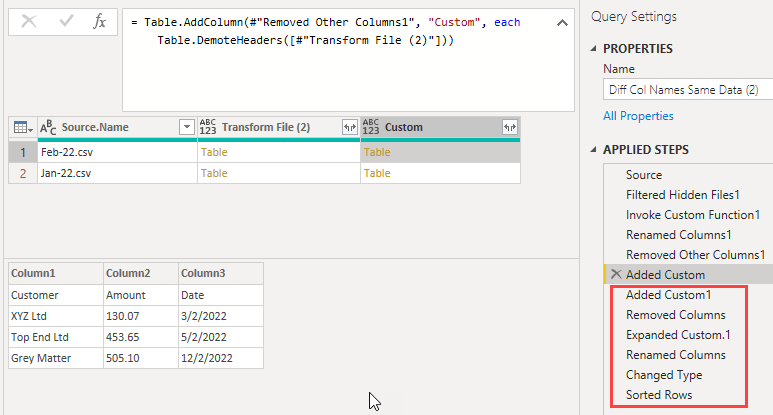
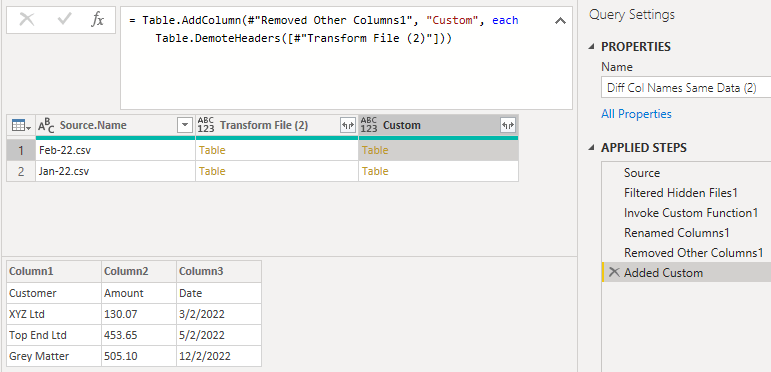
I want to demote the column headers to become the first row in the tables. To achieve this, add a Custom Column with this code using the Table.DemoteHeaders function.
The table(s) being acted upon are in the Transform File (2) column.
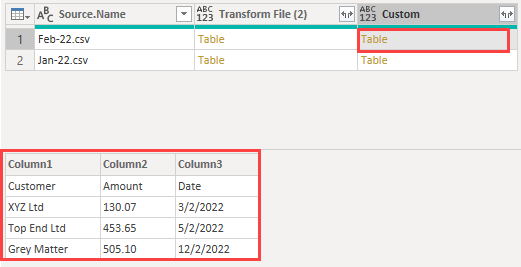
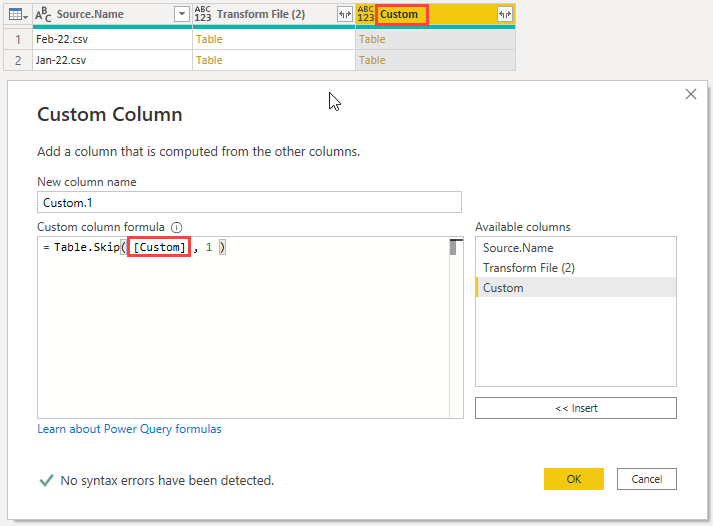
With the headers demoted in these tables I can skip the first row in each using the Table.Skip function. Add a Custom Column with this code
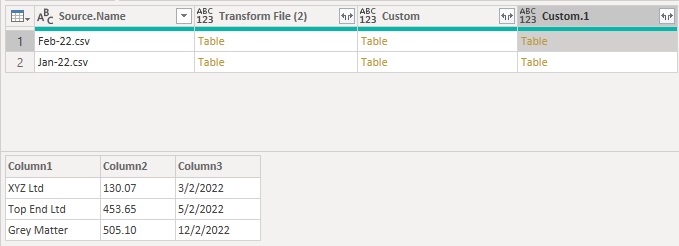
With the first rows removed each table is left with just the data. I can now delete the first 3 columns from the query and expand the Custom.1 column
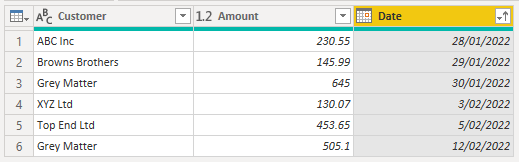
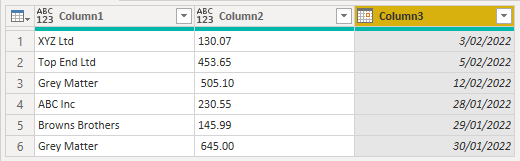
All that is left is to rename the columns, set column data types and (if you wish) sort by date.
Solution 2
Duplicate the query from Solution 1
Delete all the steps after Added Custom which demotes the table headers.
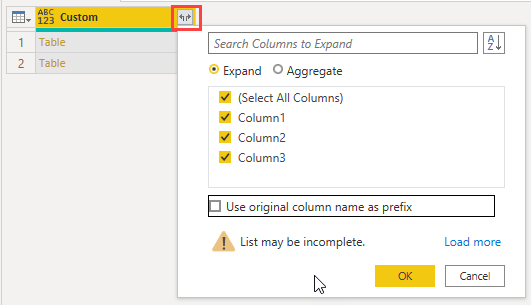
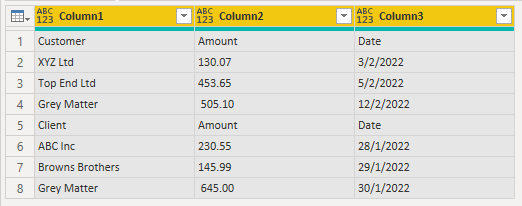
Delete the first 2 columns from the query and expand the tables in the Custom column.
Filter column 3 to remove the text "Date"
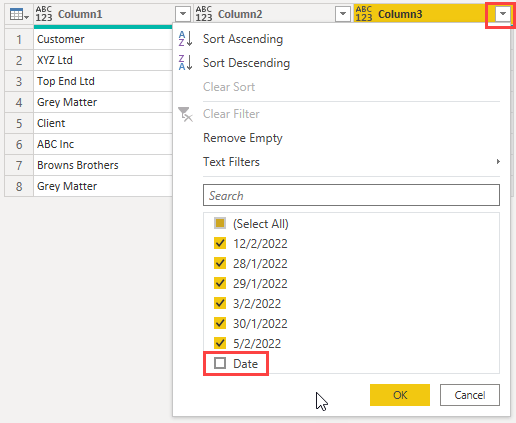
Now you can rename the columns, set data types and sort as desired.
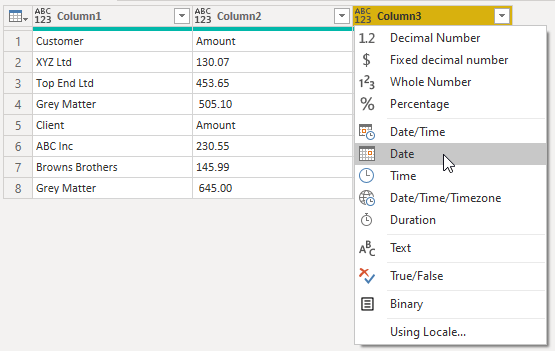
Solution 3
Duplicate the query from Solution 1, delete all the steps after Added Custom and delete the first 2 columns in the query to leave a single column Custom.
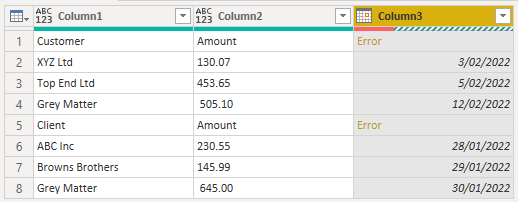
Expand the tables in the column, then convert the Date column (Column 3) to the Date type.
This will result in errors in that column, where the row contained text.
Right click on the Column 3 header and remove the errors
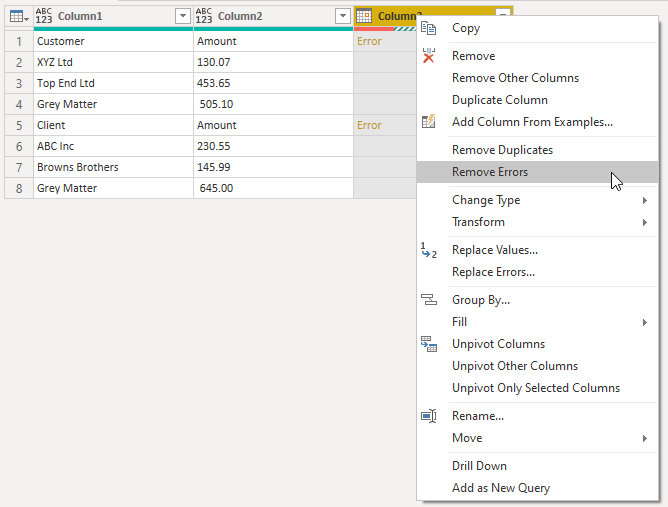
Rename the columns, set data types and sort as desired.
Solution 4
As before, duplicate the first query and delete the steps up to Added Custom so you are left with 3 columns in the query after the headers have been demoted.
The Feb file has the first column named Customer and this is what I want the column to be called in the final table.
So, delete the first 2 columns from the query and expand the tables in the Custom column
Promote headers : Transform tab -> Use First Row as Headers
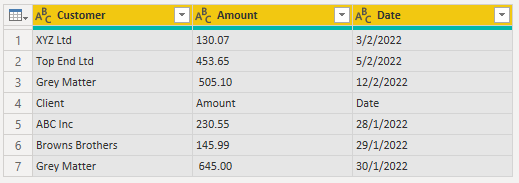
I can now filter out the header row from the table by filtering any of the columns to remove the appropriate text value. In this case I'll filter the Date column to remove the text "Date"
Rename the columns, set data types and sort.
Conclusion
Hopefully this will help you deal with situations where you also face importing columns with names that don't match up.
Let me know if you have any other scenarios with different column names causing you issues.

Good afternoon,
I am combining multiple Excel files using PowerQuery. The columns, names are the same, except some are in different cases (sentence case vs all caps). How can I fix this so when the table columns are expanded, data is not lost?
Hi Dan,
Power Query is case sensitive, so it considers the column names different. We cover how to deal with that in this tutorial: Combining files with different column names in Power Query.
Mynda
How would you handle a situation where the columns are in different orders and some files contain additional columns?
The order of columns doesn’t matter. If you have some files with additional columns, use the file that has all columns present as the ‘sample file’.
Hi,
Thanks a lot for your videos content, they’re really useful!
I hope you can help with the following scenario:
I’m attempting to combine two files from a folder. Each file is populated with discretionary costs from two different fiscal years. My problem is that the monthly data is displayed in columns ( meaning that there would be 12 columns, one for each month) .
Normally this wouldn’t represent a problem thanks to the transpose feature in power query however in this case if I were to go ahead with the dates transposing in the first file ( in the Transform sample file section) the data of the second file will show an error and it wouldn’t be uploaded because the dates are different.
Is there a way around this problem?
Thanks a lot
Piero
Hi Piero,
I would avoid the automatic transformation step in PQ, it is not flexible.
Try the solution posted here.
Thanks Catalin,
When I click on that link I don’t see anything just the home page. Is there a more specific link I can use to find an answer to my question.
Thanks a lot
Piero
Nothing wrong with the link.
Can you try again please?
https://www.myonlinetraininghub.com/excel-forum/power-query-members/source-data-column-headings-have-changed-throwing-a-power-query-error
If you still cannot open the link, please go to our forum and create a new topic with the problem you mentioned, I’ll help you.
Here is the forum link: Excel Forum
Cheers,
Catalin
thank you so much
Mo
no worries.
Hi,
Good stuff as always. Still getting my head around PQ.
A scenario I’m facing often is what I now understand to be called “stacked data”.
I can unstack it using normal Excel, but there is a lot of deleting, moving, duplicating columns etc. so that my end result is in a tabular format.
Although my data is in a ‘csv’ format. I can have several lines that would be headers, quite often there is a “totals” row. 1 stack can contain 5 transactions, another 2, another 10.
Oh and at the very end of the csv output is a grand total.
Hi Andrew,
Sounds like you are dealing with data that is already in a partial report format – such a sin! As you’re finding, the data just needs to be in a flat tabular format so that any reporting can be done later in Excel or Power BI.
These posts may help you out in dealing with badly formatted source files
https://www.myonlinetraininghub.com/power-query-unpivot
https://www.myonlinetraininghub.com/power-query-unpivot-scenarios
regards
Phil
In your first example, where you have rolling months, you took the easy step and just deleted duplicates for months where you had multiple entries. This was fine in your made up example, because the numbers didn’t change when they went from being forecasts to actuals. In the real world, this isn’t what happens. You would need to create a rule as to how you want to handle these different values.
Hi Higrm,
yes the scenario you describe is feasible. The example I used is actually from a client where the only new data they got was new month’s data added each month.
As you say, in your scenario it would be more complicated to weed out duplicates. You’d probably need to base this on keeping the most recent data so you’d be looking at manipulating the date column.
Regards
Phil