DAX is the Power Pivot formula language available in both Power BI and Excel. It stands for Data Analysis eXpression. As you can see in the images below, DAX functions are very similar to Excel functions, so it’s relatively easy for us Excel users to pick up.
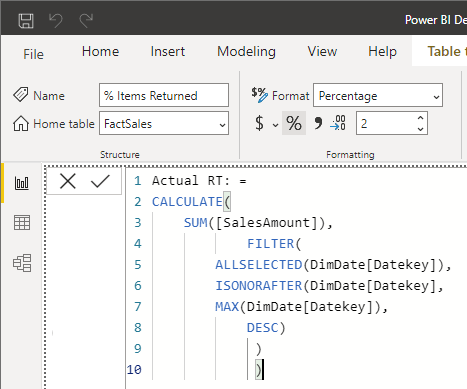
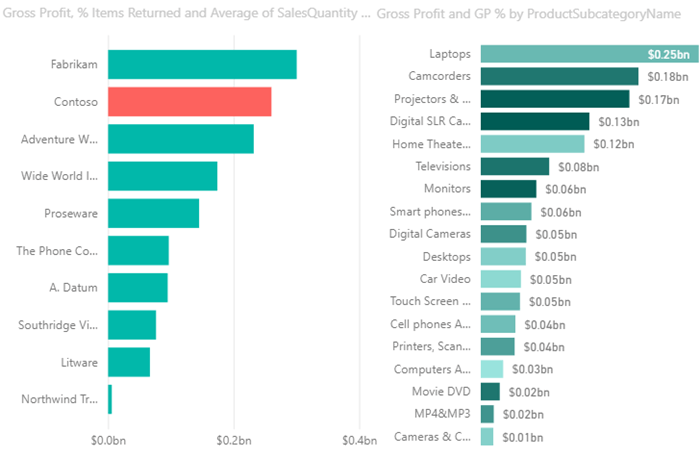
Below is a screenshot of how DAX formulas appear in Power BI:
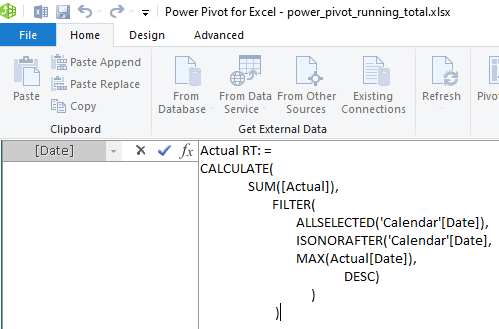
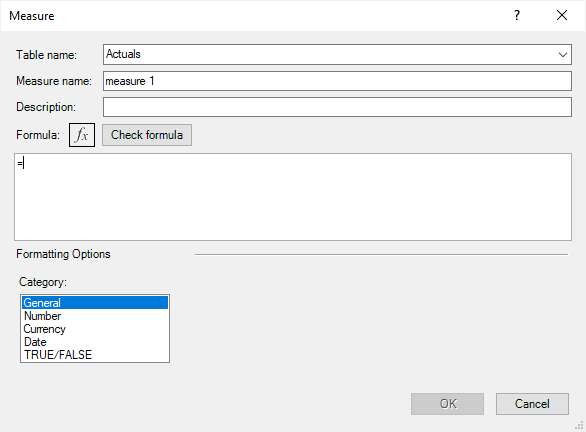
And you can see in below in Excel the interface for DAX formulas is slightly different:
We use DAX formulas to perform advanced calculations on data in related tables and columns in Power Pivot for Excel and Power BI.
Watch the Introduction to DAX Measures Video

Introduction to DAX Measures Downloads
Excel Workbook:
Enter your email address below to download the sample workbook.
Power BI Desktop App:
You can download the free Power BI Desktop app here.
What is Power Pivot and DAX
I like to think of Power Pivot as a mash up of Excel PivotTables and Access. If you’re familiar with both of these then you’ve got a head start and you’ll instantly recognise the Access features available in Power Pivot.
Power Pivot stores data in separate tables, and just like Access and other relational databases, we can build relationships between the tables and write DAX formulas used in measures, calculated columns, calculated tables and row-level security. In this tutorial we’re going to focus on the most common use, which is measures.
DAX measures enable us to analyse the data in a PivotTable or Pivot Chart in Excel.
Or in tables and visuals in Power BI.
Where to find the DAX Function List
You’ll find a complete list of DAX functions here. Each function’s page has a description, syntax, parameters, remarks, and an example.
Note that not all functions available in Power BI are available in Excel. Unfortunately, the documentation doesn’t tell you if a function isn’t available in Excel. The only way you’ll know is to try it and if the intellisense doesn’t auto-complete the function name as you type, then it’s not available.
DAX Syntax
You’ll notice that DAX functions are very similar to Excel functions. They even share some of the same names. If you're familiar with structured references for Excel Tables, then you'll recognise the TableName[ColumnName] reference style used in DAX.
Writing DAX Formulas
DAX formulas are used in measures, calculated columns, calculated tables and row level security. In this tutorial we’re going to focus on writing DAX measures because measures are what you use in your Power BI visuals and Excel PivotTables.
In both Excel and Power BI there are a few entry points for writing DAX measures.
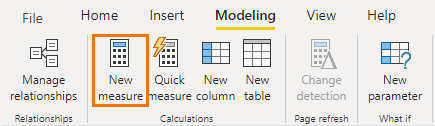
New Measures in Power BI
The ‘New Measure’ button can be found on the Home, Modeling and Table Tools tabs:
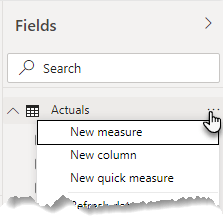
You can also access it from the table ellipsis in the fields list:
New Measures in Excel
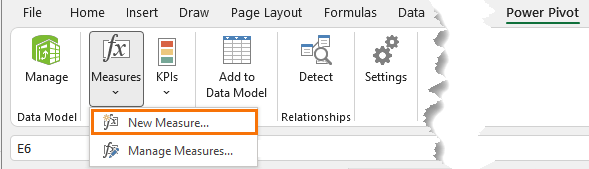
This opens the New Measure dialog box where you can also set number formatting:
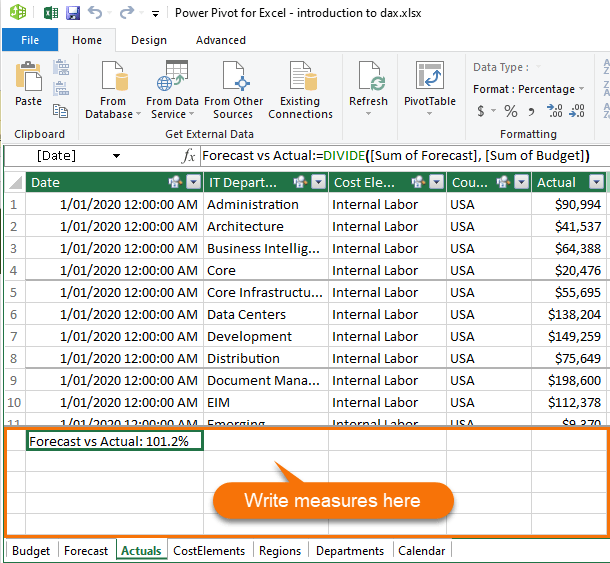
You can also write measures in the Power Pivot window in the pane below the data:
Filter Context
Filter context is easiest understood in Excel PivotTables. In the PivotTable below I have the Forecast Total measure which is =SUM(Forecast[Forecast]):
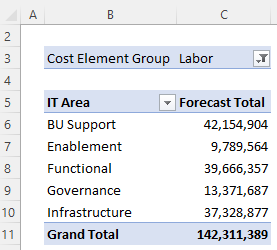
The value in cell C7 is displaying the total forecast for the Enablement IT Area and the Labor Cost Element Group. The formula in each cell is the same, but it respects the filter context of the cell by referencing the row labels and filter. Note: If there were column labels it would also respect those.
Filter context enables me to write one formula and have it dynamically adapt to return multiple results as I make changes to my PivotTable.
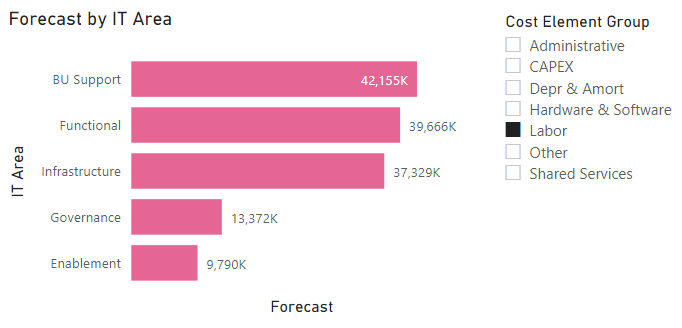
Power BI visuals work in the same way. Below I have a bar chart displaying the forecast by IT Area and filtered by the Labor Cost Element Group, as selected in the Slicer:
Nested DAX Functions
So far, we’ve looked at some basic measures and you may have realised that we didn’t even need to write them because we could simply use the implicit measures available when we drag fields into the values area of PivotTables and visuals. Typically, you’ll be writing far more complex measures where you nest functions, just like we can in Excel.
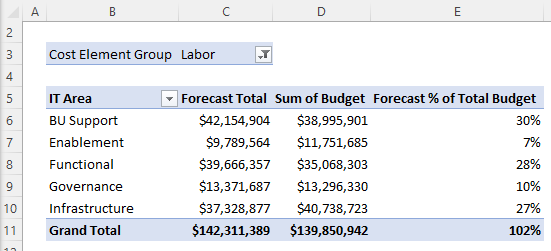
For example, let’s say I want to calculate the percentage the forecast is of the total budget. That is, what percentage each IT Area's forecast is of the Budget Grand Total.
We can do this with the DIVIDE function. The first argument of this function is the numerator and for that we can reference the measure mentioned under Filter Context for the ‘Forecast Total’, and we can use CALCULATE for the denominator (see video for further explanation):
Forecast % of Total Budget:=
DIVIDE (
[Forecast Total],
CALCULATE (
           SUM ( Budget[Budget] ),
           ALL ( Departments[IT Area] )
          )
)
When used in the PivotTable we get:
Learn DAX
If you’d like to learn more DAX, please consider my Power Pivot and DAX course.


Nice