
July 17, 2013
Excel CLEAN Formula
Ever copy and paste some data from a web page, or import it from another program, and end up with
Read More
July 17, 2013
Ever copy and paste some data from a web page, or import it from another program, and end up with
Read More
July 17, 2013
The Excel SUBSTITUTE function replaces new_text for old_text in a text string. The Excel SUBSTITUTE Function Syntax is: SUBSTITUTE(text,old_text,new_text,[instance_num]) The
Read More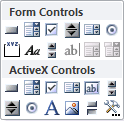
July 10, 2013
Written by Alan Murray of Computergaga. Form controls such as option buttons, combo boxes and check boxes allow you to
Read More
July 2, 2013
Today I’d like to share with you a video tutorial by Isaac Gottlieb on supply-chain decision making from his book
Read More
June 30, 2013
The Excel ACCRINT function returns the accrued interest for a security that pays interest periodically. The Syntax is: ACCRINT(issue, first_interest,
Read More
June 25, 2013
This week I had a question from Dominique that took me back to my accounting days. She asked “how can
Read More
June 12, 2013
Last week I had an email from Mike asking how he can lookup a suburb in a range of columns
Read More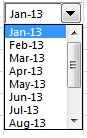
June 5, 2013
Data Validation or Drop Down Lists are one of Excel’s greatest features, but I have one gripe with them, and
Read More
May 29, 2013
Here you'll find a list of common Microsoft Excel formulas and functions explained in plain English, and applied to real
Read More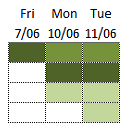
May 28, 2013
Gantt charts are handy for planning and managing project tasks over time. They give a visual representation of the whole
Read More
May 22, 2013
Gantt charts are commonly used in project management and while Excel doesn’t have a native Gantt chart in its chart
Read More
May 16, 2013
A few weeks ago David T asked me to help him understand a VLOOKUP formula in a workbook he’d inherited
Read More
May 9, 2013
A little while ago Brendan asked me how he could check if values in a list fall between two limits.
Read More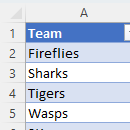
April 30, 2013
I’ve set up a table with some team names that I want to use in a Data Validation list. The
Read More
April 25, 2013
I recently came back from a family skiing vacation in Whistler, Canada, which by the way was fantastic. Here we
Read More
April 18, 2013
To be honest I don’t use Advanced Filters much. I tend to use the regular AutoFilter, or if I need
Read More
April 10, 2013
Moving back and forth between worksheets in a large workbook can be tedious. Of course you can use the shortcut
Read More![Excel PivotTable Month Comparison [Video]](https://www.myonlinetraininghub.com/wp-content/uploads/2013/04/pivot_tip_mth_change_thumb.png)
April 2, 2013
In this last tutorial, in my 3 part series on PivotTable tips and tricks, I’m going to show you how
Read More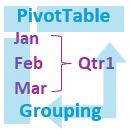
March 26, 2013
Battling to consolidate monthly figures into quarters, or segment data into numeric bands? Perhaps you're aiming for a bespoke grouping
Read More![Excel PivotTable Add Percentage of Total Column [Video]](https://www.myonlinetraininghub.com/wp-content/uploads/2013/04/pivot_tip_percent_total_thumb.png)
March 19, 2013
Excel PivotTables make light work of analysing data but there are a few tricks once you get past the basics.
Read More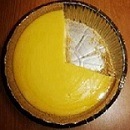
March 13, 2013
As fun as this chart is, it actually makes a valid point and that is; pie charts are (typically) not
Read More
March 6, 2013
Excel’s Conditional Formatting tool is diverse with loads of built in rules that you simply point and click to use,
Read More
February 27, 2013
PivotTables are the Origamists of Excel. Folding and summarising data into almost any shape. I say 'almost' because until Excel
Read More
February 20, 2013
Note: Excel Survey is now called Forms. A while back Quiara asked me if there was a way she could
Read More
February 13, 2013
Working with Dates in Excel can be frustrating because a date criteria in one formula doesn’t always work in another.
Read More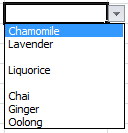
February 6, 2013
Last week I showed you how you can extract a list that excludes blank cells for use in a data
Read More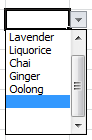
February 1, 2013
Last week Keith asked how he can ignore blanks in a range referenced by a Data Validation list. I think
Read More
January 30, 2013
Help! Do you use a non-US-English version of Excel? If so, now is your chance to help out the wider
Read More
January 17, 2013
I don’t know about you but I’m forever converting things. In Australia we use the metric system. Our pounds are
Read More
December 19, 2012
2012 has been an amazing and rewarding year at My Online Training Hub and we’re excited to see what 2013
Read More