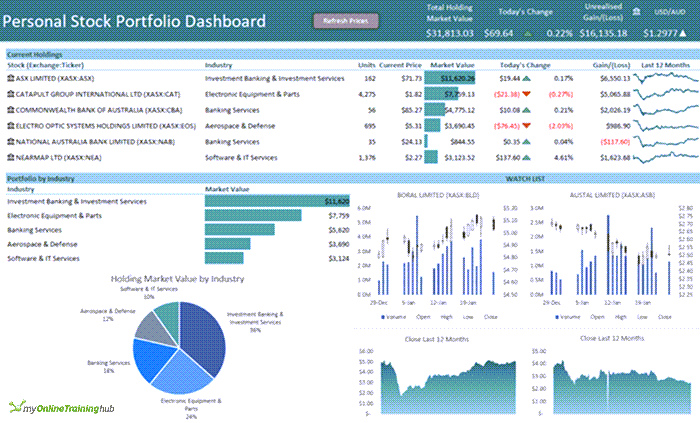
Keeping track of your share trading is easy with this personal stock portfolio dashboard. It uses the latest Excel tools* including Data Types and the STOCKHISTORY function to create a report that’s connected to live data and updates at the click of a button.
*Note: requires Microsoft 365. Not suitable for Excel 2019 and earlier.
Watch the Video
See how this dashboard can be built in under 30 minutes in this step-by-step video:

Download the Personal Stock Portfolio Dashboard File
Enter your email address below to download the sample workbook.

Personal Stock Portfolio Dashboard Techniques Used
I used several techniques to build this personal stock portfolio dashboard and you’ll find the links to individual tutorials on these topics below:
- Excel Tables – format your source data in Tables to make it easy to reference in formulas using the Structured Referencing that comes automatically when you insert the Table.
- Excel Data Types – connect your files to rich live online data with updates at the click of a button. Available for stocks, currency and much more.
- PivotTables – extract subsets of your data quickly and easily with PivotTable Report Filter Pages.
- STOCKHISTORY Function – get historical price data about financial instruments.
- UNIQUE Function – extract a list of unique or distinct values from a range or array.
- SORT Function – sort cells or arrays in ascending or descending order.
- SUMIF Function – sum a range of cells based on a condition.
- TEXT function – apply custom formats to numbers in a formula.
- Conditional Formatting – make it quick and easy for users to interpret reports with visual indicators.
- Custom Number Formats – change the appearance of numbers to suit your needs. Rounding to millions or billions, leading zeros, color coding, symbols and more.
- Sparklines – create cell sized charts to illustrate trends and patterns in your data.
Learn More
The topics above are a great start, but if you’d like to take your Excel skills further, please consider our courses below:
Excel Dashboards Course – A comprehensive course designed to give you the skills to build dashboards for any industry.
Excel PivotTable Quick Start – this course will help you overcome your fears and challenges with building PivotTables. It’ll have you up and running in under 2 hours.
Excel Advanced Formulas - I’ve designed this course to get you quickly up to speed with the functions that are going to give you the biggest efficiency gains. Many of the functions are considered advanced, but when you’ve finished the course, you’ll know like I do, that everything is easy once you know how.
Excel Expert Course – This course includes the PivotTable Quick Start and Advanced Formulas course as well as a load more topics covering everything from beginner topics (which you can skip if you already know them) to more advanced topics.
Power BI Course - Power BI offers functionality we can only dream of in Excel. Including secure sharing of reports on any device, clickable chart elements that cross filter and highlight other charts, and much more.


Helo Mynda, How do we use the ticker from other exchanges, example AMS: ASML. When i update ASML on Ledger it only puls the exchange ASML Holding NV (XNAS:ASML)
Not all exchanges are supported. You can see the ones that are here: https://support.microsoft.com/en-us/office/about-the-stocks-financial-data-sources-98a03e23-37f6-4776-beea-c5a6c8e787e6
Hi Mynda,
thank you so much for this fantastic Portfolio Dashboard.
It took me a while, but thanks to your excellent teaching skills, I was able to understand all the used terms and formulas.
I entered several years of trading history into the ledger and was curious how my personal stock picking timing turned out over the years.
Therefore, I tried to implement the IRR Function (internal rate of return) on the dashboard. Sadly, I couldn’t get a valid result.
Could you give me some pointers?
Thank you!
Chris
Great to hear, Chris! Please post your question on our Excel forum where you can also upload a sample file and we can help you further with the IRR issue.
Dear Mynda
I built this portfolio dashboard a couple of years ago and it has worked fine. However, something has happened that prevents automatic updates when I open the dashboard. I tried Refresh All under the Data tab, which worked for a few times. Now, after hitting Refresh All, I receive the error message “We refreshed some of your data, but we couldn’t refresh all of it on our side. For the data we can no longer refresh, we’ve kept the most recent results.” The #FIELD! error appears within all fields under ‘Today’s Change’ columns. Some of my Watchlist graphs are also corrupted. But nothing is updated. Grateful any advice to fix this problem.
Also, one other minor problem. The titles of all my shares are capitalised except one. I have tried to rewrite this share name with Caps Lock but it keeps reverting to lower case. How would only one share title not be automatically capitalised on typing its entry, like all my other share titles. Thanks in advance for your assistance. Steven
Hi Steven,
It sounds like maybe the data for those shares is no longer available through the STOCKHISTORY data source provider. You could try re-writing the formula in a new file to test that it’s not something specific to the file that’s causing the problem.
As for the capitals, I’d say that’s how it is stored in the source provider’s database. The best you could do is use a font that’s all caps like Felix Titling, to force it to display the way you want.
Thanks Mynda for your advice.
I have another problem on the watchlist page with the pivot table. I have about 20 stocks on my watchlist. But for about half of these stocks the PE column does not calculate (#FIELD! error). I believe this error stops my entire dashboard from automatically updating on opening. I have tried redrafting the stocks from the start yet the problem persists. Any guidance much appreciated. Thanks.
Hi Steve,
You can use the IFERROR function to handle errors. If you get stuck please post your question on our Excel forum where you can also upload a sample file and we can help you further.
Mynda
Hi
How can I take out the copyright message on MAC?
BR
Enrique
Hi Enrique,
I presume on a Mac the equivalent of CTRL is Command, so try holding Command while left clicking the outer edge of the text box and then press DELETE.
Mynda
I would like to add fields into my Excel spreadsheet that can add insight to a stock not provided in the card (available via the excel program), but are available in FinViz. I noticed in Google Sheet I can import specific fields like RSI and tons of other fields that can help analyze stocks. I think it’s called scrapping data, can do that auto updating of fields like RSI (or other fields) not provided inside of office 365 and if available, how? The RSI formula in google sheets is: RSI: =(substitute(index(IMPORTHTML(“http://finviz.com/quote.ashx?t=”&B2,”table”, 8),9,10),”*”,””))*1
Excel doesn’t have an equivalent function, but you could try using Power Query to scrape the data from the web page.
Ok, So I downloaded the stock spread sheet. As I am using Libre cal. It tock me about an hour to do this. SO I found that I cant place tickers in the dash board. As I did place them in, but placed them in the ledger. As I am on the internet. I don’t see the companies coming up. Did I do something wrong.
If yes. working with Libre cal.
looking to see what happens
Hi James, the STOCKHISTORY and Stocks Data Type are not available in Libre calc. You need Microsoft Excel to create this dashboard.
Also, the “Stock” column will contain Stocks where Units are 0 because of these E numbers. Even though the Stock formula has Units 0. Scratching my head to get rid of it.
Thanks again
Hi
My “Ledger” contains years of data. When I use the formula to calculate UNITS =SUMIF(Ledger[Stock],B6#,Ledger[Units])
some values, which should be ZERO appear with E, like -1.42109E-14.
I have tried manipulating the Units column in Power Query to ROUND the values but it does not work.
I wondered if you may have a solution I could try.
Hi Kasey, it certainly sounds like a rounding issue. Please post your question and sample Excel file on our forum where we can help you further and our answers can also help others: https://www.myonlinetraininghub.com/excel-forum
Hi I would like to see my investments all in one place as I use three different brokers to invest at the moment and would like to simplify my task of viewing my portfolio.
Great. I hope this tutorial helped point you in the right direction.
Hi Mynda,
I am trying to build a customised trading tool for my office with interactive dashboard. Can you please help me with some formulas and algos.
Thanks
Hi Anshul, please post your question on our Excel forum where you can also upload a sample file and someone can help you further.
Hi Mynda,
thanks for an amazing tutorial. I ran into a small problem when I replicated it following your video. I am not able the paste the up/down triangle symbols into the formula for the USD/AUD conversion rate. Any ideas what the problem might be?
Thanks,
Tim
Hi Tim, you have to edit the cell containing the up/down arrows and copy the individual text items by highlighting them. i.e. you can’t just copy the cell containing the symbols.
Dear Mynda
Thanks for the tutorial on developing my personal stock tracking dashboard. The dashboard is very helpful. Two queries;
(1) APT was taken over by Block (NYSE) and my APT shares were converted to SQ2 CDIs on ASX. I have tried to update my stock spreadsheets, but the ticker for SQ2 cannot be found. Do you know why the inbuilt tools cannot find SQ2 on ASX data? Any solutions?
(2) I have 20+ shares on my watchlist. When I wish to add a new stock to my watchlist and use the PivotTable Analyze>Options>Show Report Filter Pages based on , a page is generated for every stock I have saved in my watchlist plus one new page for my new stock. But I only need the page of the new stock I wish to add to my watchlist. This is not a big hassle, as I simply delete the pages generated for my existing (saved) watchlist stocks, and work with the last page (i.e. the new stock I am adding to my watchlist). But is there a more efficient means to generate just one ‘new’ page for the new stock I am adding rather than 20+pages every time.
Many thanks
Hi Steven,
Glad you found this tutorial helpful 🙂
1. I suspect there is a lag in the data available from Refinitiv regarding your APT stocks. I’m not sure what the solution is, assuming you’ve already checked you have the correct ticker for the ASX version of it.
2. An alternative is to copy one of the existing PivotTable sheets and change the filter for your new stock. Otherwise, there’s no automatic way to do this without writing some VBA code to do it.
Mynda
Dear Mynda
Re Conversion of APT to SQ2
I realise my query is outside your coverage re. Excel but I have no further channels for my query. I have tried to contact Reinitiv and MS re. updating their ASX ticker for APT to SQ2. But no decent responses. I have tried entering: SQ2, Block Inc., Block Inc. (ASX:SQ2) into the relevant fields, and various iterations, but always returns either NYS or XBUE ticker results, not ASX. This is frustrating as I am now not receiving accurate tracking of my share portfolio. I wonder whether I am entering the correct data for excel to show the ASX ticker data for SQ2/APT? I am requesting whether you could check the data that I am entering on your example dashboard to see whether your can obtain the correct ASX data? many thanks.
Hi Steven,
The only thing I can think is CDI data is not available. You can use Power Query to connect to a web page and bring the SQ2 data in that way. Sorry I don’t have a better answer or solution for you.
Mynda
Hello:
Tried to use your spreadsheet Mac MS365. Message I get is: Excel ran out of resources while attempting to calculate one or more formulas. Formulas on the ASB & BLD tabs are all showing #CALC!
Sounds like your PC isn’t up to the task. Try a new file with just one STOCKHISTORY formula in it and see if it will calculate.
Hi, I had the same message and error. Very rarely excel runs out of resources… (in that case you can disable multi-threaded calc. in Options).
So I played around with the concatenation of the exchange ticker in cell ASB:C3 and referenced Watchlist[@stock] instead. Bum it worked 🙂
Still don’t know why this works though 😉
Thanks for sharing your solution, Jens.
I also had the same error messages. Per Jens’s suggestion I disabled the auto calc and was then able to enter a few stocks in the Ledger sheet. I manually calculated the sheet and it correctly filled in the transaction amount. The ASB and BSD sample sheets also calculated properly.
Problem now is the Dashboard sheet will not calculate or pull data from the other sheets.
Not sure, Robert. There seems to be a bug in some versions of Excel. I recommend updating Excel to see if it’s fixed in an update as I don’t have the problem and I’m running the latest version of 365.
When I try to use the downloaded spreadsheet I get the pop up message “Excel ran out of resources trying to calculate one or more formulas”. I am not sure how to make the spreadsheet work?
Sounds like your PC isn’t up to the job. Maybe try closing other applications to see if that helps.
Dear Madam,
I wish to learn Basic and Advance level Excel bringing more understanding and will prefer to enroll incase you are confident that this may support in my current profile.
1. I work on 1000+ material codes wrt Inward and Outward movement.
2. Multi level Reports wrt Daily / Weekly / Monthly comprising – Stock, Plan vs Actual, Liquidation
Hi Nikhil,
Thanks for your interest in our courses. I suspect the following courses will be helpful to you:
Power Query
Power Pivot
Excel Dashboards
You can get the Power Query and Power Pivot courses in a discounted bundle from our Excel Dashboard course page.
If you have any questions, please read out via email to website at MyOnlineTrainingHub.com
Mynda
Hi, I don’t see where I can download the template…great video!
Under the heading ‘Download the Personal Stock Portfolio Dashboard File’ in the post above.
Thanks for providing the template..I look forward to using it..
My pleasure 🙂
Hi Mynda,
I just watched your dashboard tutorial; it is great! Do you have any video on how to calculate total return and beta for the portfolio?
Thanks,
Luis
Great to hear, Luis! I don’t have any tutorials on total return and beta, sorry.
Hi
This is excellent. However if you have to maintain portfolio by category (which can be by person or by goal), how it can be done on this template.
Thanks!
Hi Anil,
Glad it was helpful. You can just add a column for the category and then use that field to group the data in the formulas.
Mynda
Can you please share an example
Hi Mindy,
I took the dashboard course a several years ago. Has it been updated recently?
Thanks!
Hi Rick,
I last updated it mid 2020.
Mynda
Hi, I’m Vernon,
Thanks for creating this video. I would like to add a column to the Dashboard showing the average price paid per share of stock. Would you please give me the formula for calculating the average price per share of stock, for each individual purchase of the same stock, on the ledger. (e.g. the average price per share of Commonwealth bank of Australia)
Hi Vernon,
This formula will give you the avg price paid for each stock, Place this in the topmost cell of your new column
=SUMIF(Ledger[Stock],B6#,Ledger[Transaction Amount]) / SUMIF(Ledger[Stock],B6#,Ledger[Units])
Regards
Phil
Thank you very much.
no worries.
Hi Amanda,
Thank you so much for your video and the explanations!
I struggle to make the currency of all data in the excel sheet in EUR. Do you have any suggestion on how to tackle that problem? Since I Buy in EUR it I would need to make an extra column or just put in the purchase price in USD according to the exchange course at the time of transaction? Also I think all my ETFs and share are bought over European trade floors but I can not set this as well.
Any help would be highly appreciated
Hi Adrian,
If you purchase shares in different currencies then add a column that converts them to a common currency and then reference this new column in your Dashboard formulas.
I’m not sure what you mean by “I think all my ETFs and share are bought over European trade floors but I can not set this as well.” What setting are you expecting to be able to set?
Mynda
Thanks Mynda!
Great portfolio dashboard tutorial!
I tried adding more units of INVOCARE LIMITED to the same ledger table, and it seems that the total transaction amount for the new units, is added to the previous closed position transaction amount for the function under the gain/loss column. is there a way to work around this to only get unrealized gain/loss?
Glad you liked it, Jason! To exclude closed positions, add a column to your Ledger for the status and enter ‘closed’ where relevant. Then in the summary formulas on the dashboard you can use SUMIFS to only include items in the ledger that are <> “Closed”. Hope that points you in the right direction.
Thank you so much! It worked!
Thanks Mynda,
I did try VLOOKUP, but got the #NA error.
=VLOOKUP(B6#,Ledger,9,false) Where 9 is the new column I added to the Ledger Table.
Is this the apostrophe problem?
Hi David,
I answered this same question here on the forum.
Mynda
I have added a “Group” column to your Ledger Table which holds a text value. What is the correct formula to display that text value on the dashboard in C6, the “industry” column?
I should be able to figure this out I know. But I’m out of wine.
Thanks,
David Hill
Hi David,
You can use a lookup function like INDEX & MATCH, VLOOKUP or XLOOKUP if you have a Microsoft 365 license.
Mynda
Hello,
I am using your ledger with Bitcoin transactions however it is not doing the unique function as it shows me all lines in the dashboard. Can you help me out to see what is wrong in the formula?
Hi Mark,
Please post your question on our Excel forum where you can also upload a sample file that shows your formula and we can help you further.
Mynda
STOCK PORTFOLIO DASHBOARD is superb ! (almost)
I was able to modify your Portfolio Dashboard – utilizing the more complicated SUMIFS() function, rather than the more basic SUMIF(). This allows for creating multiple Dashboards from a single Ledger data source by adding an ACCOUNT column. With your permission, I would like to share this with my Investment Club members. I will of course attach your copy right warning for the basic format.
Good Job Mynda !
Sure, Brendon. No problem. Glad it was helpful.
Your video explaining the many uses of STOCKHISTORY has been a revelation to me. I guess many people who are interested in stocks have a taxed dealing account and a tax exempt account. I’ve tried to figure out how to implement Brendon’s idea by adding an additional Colum in the Ledger called Account which has either “ISA” or “Dealing” as the entry and then creating two dashboards. I’ve made countless attempts to change =(UNIQUE(FILTER(Ledger[Stock],SUMIF(Ledger[Stock],Ledger[Stock],Ledger[Units])0))) to a SUMIFS formula that uses Ledger[Account],”ISA” or “Dealing” but I can’t get it to work. Could you or Brandon help.
I really enjoy receiving your emails!
Hi Terry, that’s great to hear! Please post your question on our Excel forum where you can also upload a sample file and we can help you further.
great!
Glad you liked it!
Not sure why but I can’t get the spilled range (#) operator working in my Excel 365 version 2102 build 13801.20294 (Current Channel) installation.
None of the examples in your video let me use the #.
This should be available in this recent build, right?
Anything special required to enable it?
Hi Niet,
Yes, if you’re on the current channel and haven’t got any pending updates (check File tab > Account) it should be available in your version. The spilled range operator only works on ranges that contain spilled array formulas. If you’re trying to reference any old range, then it won’t work like that. If that’s not the issue, please post your question and sample Excel file on our forum where we can help you further: https://www.myonlinetraininghub.com/excel-forum
Mynda
Great video, what I have been looking for ‼️
Is there a way to add a column with different dates, MTD, WTD, YTD, etc?
Thanks, Michael. I’m sure you could modify it to add MTD, WTD and YTD.
Mynda
BVUt how? – I have searched all over, watched many videos, can’t find
Hi Michael,
I don’t have an example I can point you to, but you can add extra columns for each period and then use a SUMIFS formula to return the sum for period for the respective columns.
If you get stuck please post your question on our Excel forum where you can also upload a sample file and we can help you further.
Mynda
wow…this is amazing. Love everything about your courses. I’m planning on upgrading my membership
thank you
Mo
So pleased to hear that, Mo!
I LOVE your tutorials! Just discovered them and they are GREAT. Thank you. One question. You mention that you can protect from users resizing slicers, but can you prevent users from resizing charts and graphs? Thanks!
Thanks, Daron! Yes, you can prevent users resizing charts or any object with worksheet protection.
Mynda
Hi Mynda,
Thanks for your videos. They’re terrific.
I reproduced your stock portfolio dashboard and encountered a minor glitch that I have not been able to solve. If the security is an ETF then the Industry column will show #FIELD!. How can this issue be resolved so that I can still allocated security concentrations between economic sectors.
Best,
Hi James,
Great to know you enjoy my videos 🙂
Regarding the #FIELD! error, if the data doesn’t exist for a card field Excel will return the #FIELD! error. In other words, you can’t resolve it because the data you’re asking for isn’t available for that stock.
Mynda
She may want to use an IF statement to remove that error from the spreadsheet for those stocks/ETFs that don’t have the data desired. I appreciate explaining why it’s not working and it makes sense, but it looks off when that error is displayed. Just a thought.
Good idea. You can use IFERROR to return ‘unclassified’ for stocks that return #FIELD! errors for the industry.
Mynda – you such an amazing and gifted teacher.
Thanks so much, Steve!