With the new Excel STOCKHISTORY function we can finally get historical price data for stocks, bonds, funds, crypto and foreign currency exchange rates into Excel, including open, high, low, close and volume.
The STOCKHISTORY function is currently only available on the Beta channel (previously Insider Channel) to Microsoft 365 users (previously Office 365). Plus, it is only available to 50% of users on the beta channel, so don’t be surprised if you don’t have it yet. Whether you’re in the lucky 50% who have it or not is a complete lottery!
The data is provided by Refinitive and you require a connection to the internet to get the data.
Watch the Video

Download Workbook
Enter your email address below to download the sample workbook.
Excel STOCKHISTORY Function Syntax
The syntax is:
=STOCKHISTORY(stock, start_date, [end_date], [interval], [headers], [properties1],...)
| Argument | Description |
| stock | Stock or currency ticker symbol in double quotes e.g. "MSFT" or a reference to a cell containing the ticker symbol or the Stocks data type. If you want to get a price from a specific exchange, prefix the ticker symbol with the market identifier code (e.g. "XNAS:MSFT"). |
| start_date | The earliest date for which data is retrieved. Note that if interval is not 0 (daily), the first data point may be earlier than the start_date provided - it will be the first date of the period requested. Dates can be entered enclosed in double quotes e.g. "31-1-2020", a reference to a cell containing a date, or a formula e.g. TODAY(). |
| end_date | Optional. The latest date for which data will be retrieved. Default is today, however prices are only available after markets close, therefore data will be up to yesterday or the last day the markets were open. |
| interval | Optional. Specifies the interval each data value represents as follows: 0 = daily, 1 = weekly, 2 = monthly. Default is 0. |
| headers | Optional. Specifies whether to display headings as follows: 0 = no headers, 1 = show headers, 2 = show instrument identifier and headers. Default is 1 (i.e, show headers). When included, headers are rows of text that are part of the array returned from the function. |
| property0 to property5 | Optional. The columns that are retrieved for each stock as follows:
|
Excel STOCKHISTORY Function examples
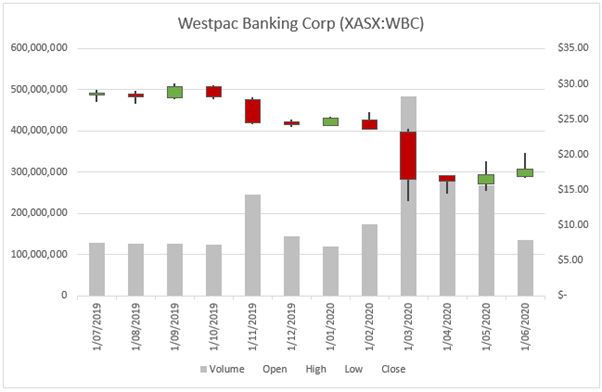
In its most basic form, you can look up a stock for a date range and STOCKHISTORY will spill an array of dates and closing prices:
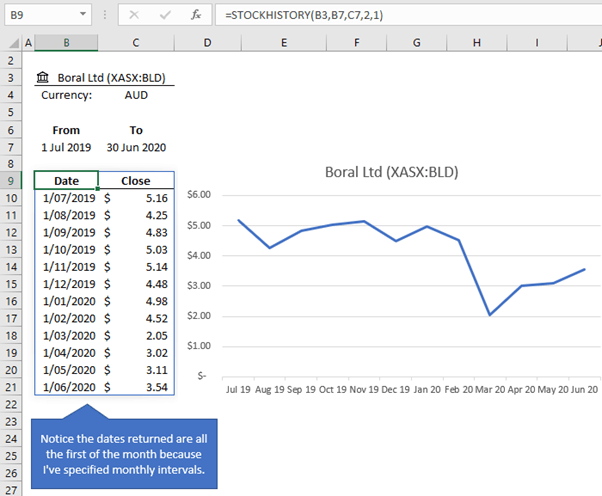
Note: I’ve linked it to a Stock Data Type in cell B3, but you could just as easily enter the stock symbol in double quotes inside the formula e.g. "BLD", or reference a cell containing the stock symbol.
The formula from the image above, translated below:
=STOCKHISTORY(B3,B7,C7,2,1)
In English reads:
Look up the BLD stock on the Australian Stock Exchange and return the closing prices at monthly intervals from 1 July 2019 through 30 June 2020 and include column headers.
By default, it will return the date and closing price because I haven’t specified the optional property arguments.
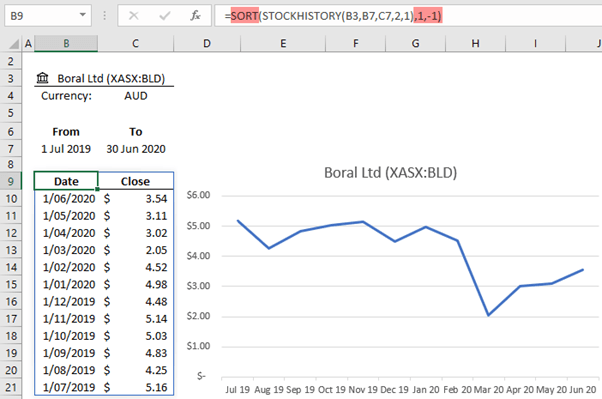
Sort STOCKHISTORY Data
The data is sorted in ascending order by date, but if you prefer the data sorted in descending order, you can wrap it in the SORT function:
Specify Data to Return
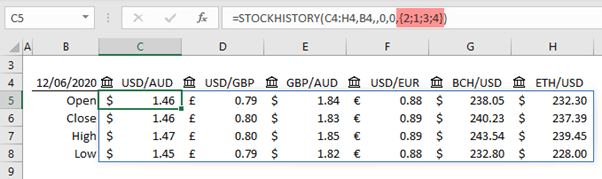
If you prefer to specify the columns you want returned you can use the ‘property’ arguments to list the columns and their order, where 0 is date, 5 is Volume, 2 is Open, 3 is High, 4 Low and 1 is Close:
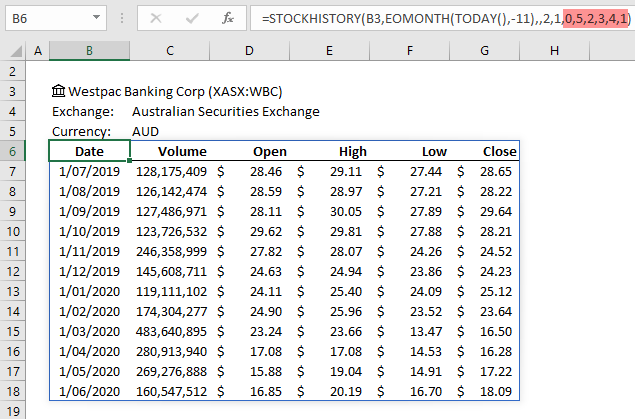
Being able to specify the columns returned in the Property arguments is particularly useful if you want to insert a stock chart that requires the columns in a specific order:
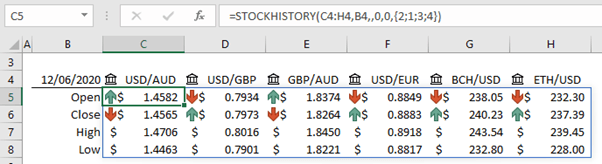
Crypto and Foreign Currency STOCKHISTORY
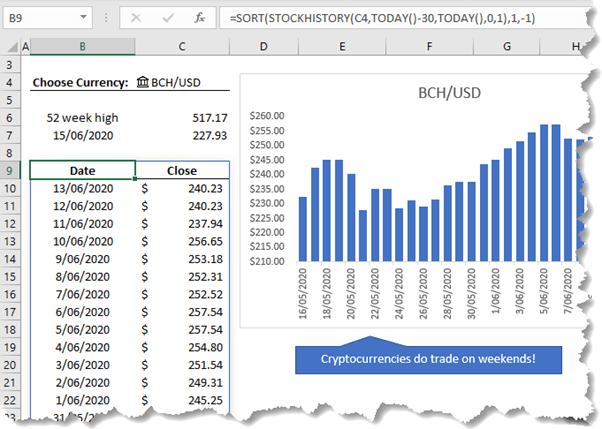
Foreign currency and cryptocurrency exchange rates are also available:
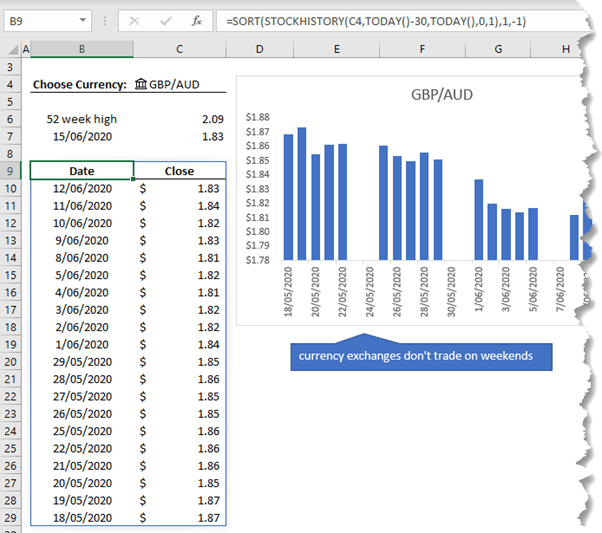
Traditional currencies don’t trade on weekends and the spilled data skips those dates (the chart above uses a date axis which includes weekends), however Cryptocurrencies like Bitcoin do trade on weekends, as you can see below:
IMPORTANT: Intraday prices aren’t available with STOCKHISTORY. If you use the TODAY() function as the date_end argument it will only return data up to the last close of market which could be yesterday. Note that yoou'll get an error for any exchanges that don't trade on weekends. This post discusses options for handling weekends. In the examples here I’ve used the stock data type to return the intraday price in cell C7. There is a two day gap between the data STOCKHISTORY returns for me and the date in cell B7 because I am 17 hours ahead of the U.S. exchange!
Referencing Spilled Arrays
Because this is a dynamic array formula, we can reference a range of cells containing multiple currency pairs (C4:H4) and spill the results. Notice in the properties argument I’ve also inserted an array of the property values I want spilled to the rows:
You can also apply conditional formatting to the results:
Or Sparklines:
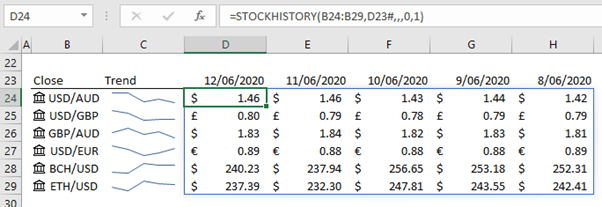
Tip: Did you notice in the image above that the date is linked to a dynamic array in cell D23#. You can see in the image below that I used the SEQUENCE function to return an array of dates using the date serial number 43994 as the starting date:
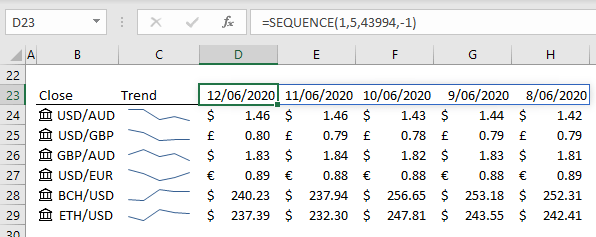
Of course, you could nest the SEQUENCE function inside STOCKHISTORY like so:
=STOCKHISTORY(B24:B29,SEQUENCE(1,5,43994,-1),,0,0,1)
However, you can’t display the headers with this formula, so I thought it made more sense to use SEQUENCE for the headers, and reference them in the start_date argument.
Formatted Number Values (FNVs)
The STOCKHISTORY function is the first function that comes with number formatting. It will apply currency formats when the cells are formatted in ‘General’ i.e. when cells have no number formatting applied.
FNVs can also pass through lookup style functions such as XLOOKUP, INDEX, IF, CHOOSE, or simple cell references e.g. =C5. However, FNVs are ignored by other functions which only see their number value.
Charts can also pick up FNVs! However, if you’re linking your STOCKHISTORY formula to a data validation list that allows you to choose a different stock/currency pair, the chart won’t pick up the changes, as you can see below ☹
Excel STOCKHISTORY Function Errors
With this new function we also get a new error: #BUSY! You’ll see the #BUSY! error while Excel is getting the data. It should disappear quickly, although the more dates and columns you want returned, the longer it will take.
Another error you might see is #BLOCKED!, which appears when you try to retrieve data that isn’t available. For example, if you reference an empty cell for the ‘stock’ argument.
For me #CONNECT! also appears sometimes after Excel crashes and I reopen the file. This could be caused by the Stock Data Types. It's nothing a reboot doesn’t fix though 😊

Kindly need brent Crude oil symbol.
That’s not something I can control. Microsoft decide which symbols they provide, sorry.
Hello,
Thanks for your valuable work to make things easy 🙂
Having a question about Stockhistory function.
is there any possible to get all time high value along with Date (in months) historical data
I’m getting the value by applying =MAX(STOCKHISTORY(K8,J6,K6,2,1,3)) but not date..
can you help me wether this can achiable or not
Hi Hemanth,
You can use the FILTER function to extract the date and high like so:
=FILTER(STOCKHISTORY("MSFT",TODAY()-365,TODAY(),2,0,0,1),MAX(STOCKHISTORY("MSFT",TODAY()-365,TODAY(),2,0,1,1))=STOCKHISTORY("MSFT",TODAY()-365,TODAY(),2,0,1,1))Or you could simplify it with LET like so:
=LET(
high,MAX(STOCKHISTORY("MSFT",TODAY()-365,TODAY(),2,0,1,1)),
data,STOCKHISTORY("MSFT",TODAY()-365,TODAY(),2,0,0,1),
FILTER(data,MAX(high)=INDEX(data,,2)))
Mynda
Hey Mynda!
This is great, I love the STOCKHISTORY function. Thank you for taking the time to share more ways to use it. I was using this formula set up =STOCKHISTORY(B3,EOMONTH(TODAY(),-11),,2,1,0,2,3,4,1) to mirror what you did. However, it only returns one date line–in my case the date of 3/1/2022 (today is 2/8/2023). It won’t spill the following 11 months.
I tried to download your template, and after downloading, it has the same issue as above in my own build spreadsheet. Any suggestions to get it to work to spill the desired amount of months?
Hi Dustin,
It looks like you don’t have an End Date argument, so it will only return one day’s worth of data. Your formula should be:
Mynda
The Stockhistory function of Microsoft 365 has a technical flaw. The details extracted are not adjusted for Market Events like StockSplit, Bonus Issue and Dividends.
Due to this the prices extracted give a misleading image.
For example: due to a split of 1 is to 10, the share prices before the split are significantly higher than the prices after the split.
Please tell me what should I do to overcome this problem.
From what you describe it sounds like it’s returning the correct prices i.e. before the stock split the price is higher than after. I don’t understand the issue.
Hi Mynda, I m getting VALUE# error while finding historical data for S&P BSE SENSEX IDX. Any suggestions?
Hi Prashant, the #VALUE! error means Excel doesn’t recognise the reference you’ve given the formula. Not all exchanges are supported, so maybe that’s the issue. You can see a list of supported exchanges here.
Hi,
I keep a manual record of our portfolio holdings’ classification detail (sourced from Morningstar), such as region, style and size, category, sector, stock stats, portfolio mix (for ETFs), etc. Whilst the MS365 stock data type allows me automated updates of prices, currency rates, etc., I am wondering whether there is a way to also automate the classification information mentioned above. Please advise.
Thanks,
Hi Wallace,
The Stock Data Type has additional information you can extract like industry etc. that might be of use.
Mynda
Hello, great tutorial and thank you so much for posting this. Question for you, do you know how far back (date wise) StockHisory function will go? I’m trying to go back 5-10 years and can’t seem to get past 2018…
Good question. I can’t find any documentation on this, sorry.
Hi, many thanks for your great session re Stock History. but … I am having a problem! When I use stock history and the stock has had a trading halt it returns and error. This creates problems with subsequent formulas using that data. What I would lie to do is use the previous days losing price to allow the formula to calculate say ATR etc.
Could you explain how I can achieve this please.
Many thanks
Barry M
Hi Barry,
You can use IFERROR to return the previous day’s result if STOCKHISTORY returns an error by referencing the previous cell or inserting the STOCKHISTORY formula referencing the previous day in the second argument of IFERROR.
Hope that points you in the right direction. If you get stuck please post your question on our Excel forum where you can also upload a sample file and we can help you further.
Mynda
Hello, I also cannot seem to get the indexes to load correctly. Trying to do the Dow Jones Industrial Average and the number it reports back is way off.. Do you know if it will report values for market indexes?
Hi Eric,
Please post your question on our Excel forum where you can also upload a sample file and we can help you further.
Mynda
I am trying to download the file to follow along, but how do I get it to appear in 365?
Hi Edward, do you mean how do you get the STOCKHISTORY function to appear in your version of Excel 365? If so, you may need to update your version of 365.
I have Office 365. I am trying to use the STOCKHISTORY formula but I am getting a #NAME? error. It also shows the same error with your excel template?
Any ideas why I get this error?
Much appreciated.
Thank you
Sounds like you might need to update your version of Office 365 to get the STOCKHISTORY function.
Yep, thanks for confirming. I was also suspecting this. I have Office 365 ProPlus. I see it is not in the list of office 365 versions that support this function.
Thank you very much.
Cheers
ProPlus has STOCKHISTORY, it’s just that your installation of it might need updating. There are different update channel frequencies, so yours might just be on a semi-annual update channel which means it hasn’t got the function yet. You can check if there is an update available via the File tab > Account, or you may need to speak to your IT people.
Hi,
Great video!
Just noticed that BCH is not Bitcoin. BCH is actually Bitcoin Cash.
Chris
Good to know, Chris.
How can we get a list of the available symbols? For example, if you’re looking for the S&P500 index, what is the ticker used? I went on the Refinitiv’s website and on the stock market’s website but I can’t find a list of the symbols that the function should recognize.
The symbols are as they’re listed on the exchange, so best to check how S&P500 list them.
Hi,
I want to get Weekly close in my Excel for a stock ? Can you please guide who to get that ?
Weekly Close & Two week Back close.
Hi Gourav, The tutorial above explains how to use STOCKHISTORY to get the closing prices. If you still have further questions, please post your question on our Excel forum where you can also upload a sample file that illustrates the issue and we can help you further.
Hi,
Tks for sharing this new exciting function.
However, I try to run the downloaded file, but encounter the error message “Excel ran out of resources while attempting to calculate or more formulas. As a result the formulas cannot be evaluated.”
What the possible reasons?
Sounds like your PC may not have enough RAM to process the spreadsheet. Or maybe you don’t have a Microsoft 365 license and don’t have the STOCKHISTORY function available.
I am overwhelmed on what you can do in Excel. I just cannot keep up. That being said, is there a way to track the price of precious metals (gold, silver) in Excel?
Excel certainly is a never ending learning opportunity, but that’s also what makes it great 🙂 I’m not aware of any way to track precious metals unless they are traded on one of the supported exchanges.
Says code must be updated for use on 64-bit systems. Any suggestions?
Hi Harry, Presumably this has nothing to do with the STOCKHISTORY function as it wouldn’t trigger this message. Please post your question and more context on our Excel forum where you can also upload a sample file if relevant and we can help you further.
You might also be interested in the freely available StockAsOfDate and StockEndOfPeriod functions in My Excel Toolbox. They utilize and require Excel’s STOCKHISTORY function. See https://sites.google.com/view/MyExcelToolbox/
Thanks for sharing!
Ma’am good evening,
Your excel sheet formulas is very interested, I want to all formulas, & some questions also
Hi Mayoor, You can post your question on our Excel forum where you can also upload a sample file and we can help you further.
Why do I get a value error for this: STOCKHISTORY(“XSWX:SREN”,”1/1/2020″,,0,,1)
Hi Mario,
Because the exchange isn’t open on January 1st. If you change the formula to:
=STOCKHISTORY("XSWX:SREN","3/01/2020",,0,,1)it returns a result.
Mynda
OK, found the problem. I had to enter an end date… I had thought it was optional
The end date is optional, but if you enter a single start date that isn’t an active exchange date, then you’ll get the error. Essentially, providing an active start date negates the need for an end date. Another workaround is to provide an active end date that negates the inactive start date. Whichever is easiest for you.
You are a wonderful teacher Mynda. I followed most of your presentations and enjoyed it so much. I have a question of stock historical data. Is there a formula to download multiple tickers with one time series in the first left column for all of them to compare using a sparkline for each? like google?
thanks.
Hi Walid,
Thanks for your kind words! I’m not sure what you mean by ‘like Google’ in your question above. In the third image under the heading “Referencing Spilled Arrays” below there is a Sparkline example. The values for the Sparkline must occupy individual cells that you can then reference in the Sparkline range. I hope that answers your question.
Mynda
Thanks for your response, Mynda. I am sorry, I did not explain it clearly. But I will try to clarify it here. Your example works fine when comparing stocks over a short period of time. However, if I need to compare historical data (Adj close prices) of multiple stocks over a long period of time, for example 1 year, there will be not enough room for the dates. They will not fit horizontally. I tried to use your equation to flip between dates with stocks; to put stocks in columns and dates in rows, but I can’t get it to work. I used this but gives error: =SORT(STOCKHISTORY(B34:B38,C4,TODAY(),0,2),1,-1) where B34:B38 = 4 stocks (for example: DAL, CCL, MGM, SPR) , and C4 is the start date for example (Today date – 365). The display would be like this:
DATE STOCK1 STOCK2 STOCK3 STOCK4 STOCK5
10/5/20 32 15 41 5.3 12
10/2/20 31 17 37 4 16
10/1/20 29 16 39 4.2 11.9
…….
…….
10/5/19 21 12 50 12 6
I can explain better if I attach a file , but I can not find an option in this form to do that. I hope I explain it right this time. Thank you very much for your help
Respectfully, Walid
Hi Walid,
We have a forum where you can start a topic and attach your file(s).
https://www.myonlinetraininghub.com/excel-forum
Phil
Hi Walid, there is an example of this layout in the file you can download with this post. See sheet FX2, the second example starting on row 13. Mynda
Thanks Mynda for your responses. This is so helpful. Phil generously got me access to training hub. it is wonderful. There is a lot to learn.
I didn’t have access to the Beta features with my Office 365 Professional Plus 2016, so I purchased a subscription to Microsoft 365 Personal, then signed up for the “Insider” channel and downloaded and installed everything. It says I am on the Beta channel, but I still don’t see the features used in this video.
Hi Mike,
Great to hear you’ve now got all the new functionality of 365. I did state this in the post above, but you may have missed it: The STOCKHISTORY function is only available to 50% of users on the beta channel, so don’t be surprised if you don’t have it yet. Whether you’re in the lucky 50% who have it or not is a complete lottery!
Usually it’s a matter of weeks before all beta users get new features, but this will depend on how smoothly the roll out goes.
Mynda
Mynda
This is really amazing stuff in particular for someone like myself who is interested in the stock market and the need to gather financial data for ones portfolio.
One thing I would like some light to shed on is the full stock exchange market it covers as I am an international investor.
Great to hear you’ll be able to make use of it. There is a link to the markets covered in the syntax explanation above for stocks. Here is it again.
Really great stuff. Thank you. But, I note that the stock information list does not include dividends or the yield (based on the dividend and closing price). This is an odd omission for a key piece of information.
Thanks, Lilian. I suspect the lack of dividend and yield data is because this is released at varying intervals and dates for different companies, whereas the price data is always available at the same time for every company i.e. at the end of everyday. Clarifying what the dividend and yield values represent would be difficult e.g. is it the last dividend, the annual dividend, what period is the yield based on etc.
Dividend and stock splits just require their own fields.
Sounds simple, but the lack of that information suggests otherwise, which I suspect are for the reasons I cited to Lilian.