
March 23, 2023
Power Query if Statements incl. Nested ifs, if or, if and
Power Query if statements, nested if, 'if or' and 'if and' statements are a bit different to writing IF formulas
Read More
March 23, 2023
Power Query if statements, nested if, 'if or' and 'if and' statements are a bit different to writing IF formulas
Read More
March 9, 2023
When working in multiple Excel files we can waste a lot of time flitting back and forth between them. In
Read More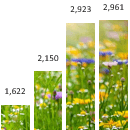
March 2, 2023
When building reports, it's important that people not only understand what you're saying but also remember it. Picture fill Excel
Read More
February 23, 2023
Writing Excel formulas is one of the most important tasks to master in Excel, but it can be a mine
Read More
February 16, 2023
Everyone’s talking about using ChatGPT for Excel and how it can improve your productivity with claims it’ll make you n
Read More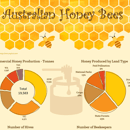
February 9, 2023
In this tutorial I’m going to share with you some hidden Excel chart techniques that will make your reports stand
Read More
February 2, 2023
Designing dashboards and reports can be a time consuming task, particularly if you’re not artistically inclined. In 60 seconds, AI
Read More
January 26, 2023
Excel templates can save you time designing, setting up and standardising forms and reports. There are hundreds of free templates
Read More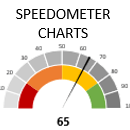
January 19, 2023
Excel Speedometer charts or gauge charts as they’re also known, have a worse reputation in data visualization circles than the
Read More
January 12, 2023
A data analyst gathers, cleans, models, analyses, and interprets data. The gathering and cleaning should be done with Power Query.
Read More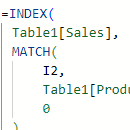
December 15, 2022
The Advanced Formula Environment (AFE) is part of the Excel Labs add-in and is still in its early stages of
Read More
November 30, 2022
Excel Formula Writing Tips, Tricks and Tools that will change how you work in Excel Formulas are THE MOST IMPORTANT
Read More
November 17, 2022
If you’re going to build dark themed Excel dashboards, then you need to have some tricks up your sleeve in
Read More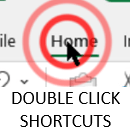
November 10, 2022
Keyboard shortcuts are great, but there are also hidden Excel double click features and shortcuts available for mouse users. Which
Read More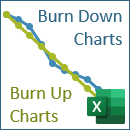
November 3, 2022
Excel Burn Down and Burn Up Charts are easy to make with line or scatter charts. If you’re familiar with
Read More
October 27, 2022
Excel WeePeople font charts enable you to build interesting variations on waffle, bar and column charts, to name a few.
Read More
October 20, 2022
One of the things that makes Excel stand apart from other reporting tools is its immense flexibility. With some tinkering
Read More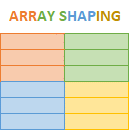
October 6, 2022
Microsoft recently released 11 new Excel functions for shaping arrays (data). I already covered VSTACK and HSTACK which was super
Read More
September 29, 2022
Custom Excel dashboard backgrounds are super easy to create and can bring a level of polish and professionalism to your
Read More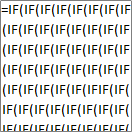
September 22, 2022
We can learn a lot from looking at what others do in Excel, both the good and the not so
Read More
September 8, 2022
The new Excel IMAGE function enables you to insert images into cells with a formula. From there you can resize
Read More
September 1, 2022
Excel VSTACK and HSTACK functions are just two of a raft of new text manipulation functions available to Microsoft 365
Read More
August 25, 2022
S-curve charts are a common tool used in project management to track the cumulative costs, hours, sales etc. over time.
Read More
August 11, 2022
In most cases you can easily remove Excel password protection if you’ve forgotten the password. However, the likelihood of your
Read More
August 4, 2022
Power Query variables are a great way to store data that can be used multiple times and can be easily
Read More
July 28, 2022
New to Windows is the ability to import data from a picture to Excel*. No more typing data manually into
Read More
July 21, 2022
I often get asked how to identify overlapping dates and times in Excel. Excel doesn’t have an ‘overlap’ function, but
Read More
July 14, 2022
Microsoft are massively investing in Excel Online and as a result there are some features that are now better than
Read More
May 26, 2022
Embedding Excel dashboards in a web page is a great way to securely share reports. All you need to do
Read More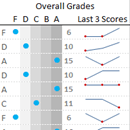
May 9, 2022
I've used a range of techniques to build the interactive Excel student performance dashboard below, which are covered in the
Read More