• Skip to main content
  • Skip to header right navigation
  • Skip to site footer

My Online Training Hub

Learn Dashboards, Excel, Power BI, Power Query, Power Pivot

  • Courses
  • Pricing
    • Free Courses
    • Power BI Course
    • Excel Power Query Course
    • Power Pivot and DAX Course
    • Excel Dashboard Course
    • Excel PivotTable Course – Quick Start
    • Advanced Excel Formulas Course
    • Excel Expert Advanced Excel Training
    • Excel Tables Course
    • Excel, Word, Outlook
    • Financial Modelling Course
    • Excel PivotTable Course
    • Excel for Customer Service Professionals
    • Excel for Operations Management Course
    • Excel for Decision Making Under Uncertainty Course
    • Excel for Finance Course
    • Excel Analysis ToolPak Course
    • Multi-User Pricing
  • Resources
    • Free Downloads
    • Excel Functions Explained
    • Excel Formulas
    • Excel Add-ins
    • IF Function
      • Excel IF Statement Explained
      • Excel IF AND OR Functions
      • IF Formula Builder
    • Time & Dates in Excel
      • Excel Date & Time
      • Calculating Time in Excel
      • Excel Time Calculation Tricks
      • Excel Date and Time Formatting
    • Excel Keyboard Shortcuts
    • Excel Custom Number Format Guide
    • Pivot Tables Guide
    • VLOOKUP Guide
    • ALT Codes
    • Excel VBA & Macros
    • Excel User Forms
    • VBA String Functions
  • Members
    • Login
    • Password Reset
  • Blog
  • Excel Webinars
  • Excel Forum
    • Register as Forum Member

Power BI Organizational Data Types in Excel

You are here: Home / Power BI / Power BI Organizational Data Types in Excel
Power BI Organizational Data Types
April 21, 2021 by Mynda Treacy

Power BI Organizational Data Types in Excel allow you to store attributes about your data in a single cell. This rich data can then be referenced with the formulas we know and love.

Imagine having a single cell that contains everything you need to know about a product or employee or a company, to name a few. This rich data might include images, pricing, stock on hand and much more.

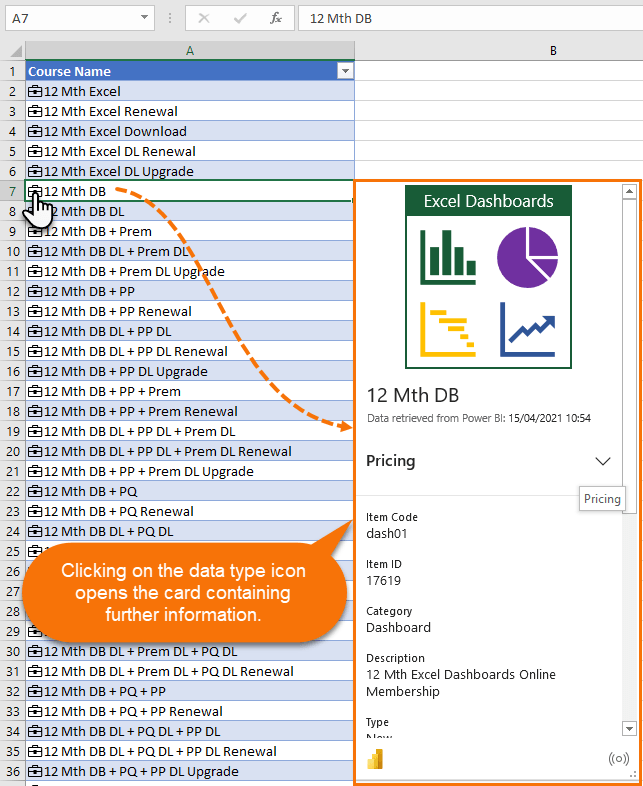
In the example below I’ve created a list of our courses as an organizational data type. You can see when I click on the data type icon to the left of the course name the card opens showing the data available in the cell:

Power BI Organizational Data Types Example

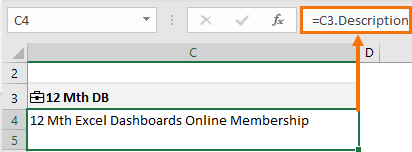
You can also use formulas to reference the data and or bring it into other cells and perform calculations on it:

Power BI Organizational Data Types formula

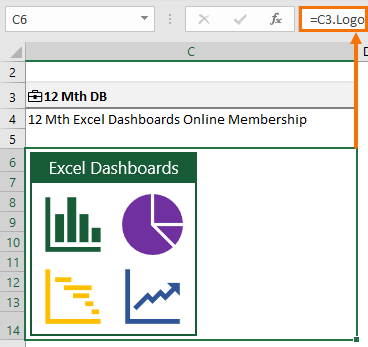
You can even display resizable images from the data type in a cell:

Power BI Organizational Data Types Image

We store the organizational data in Power BI and users who have permission can reference it from any Excel file. This vastly reduces the size of our Excel files with Power BI acting as a storage repository that can be managed and controlled in a single central location.

Updating the data is easy and with a click of the Refresh All button users can get the latest information.

Examples of uses for Power BI Organizational Data Types in Excel include invoicing, quoting, and planning to name a few.

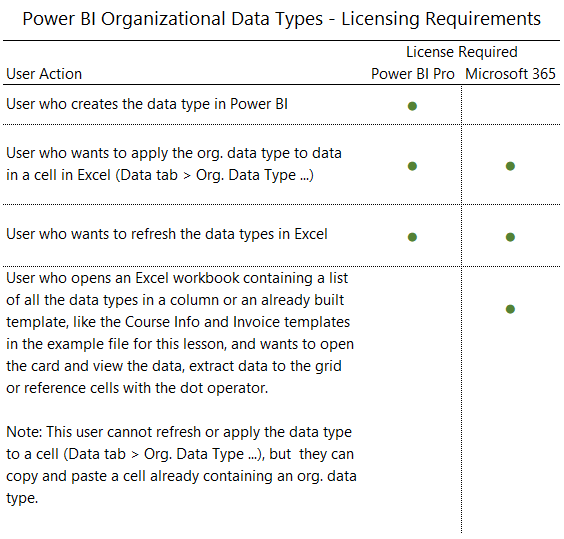
Licensing Requirements

Power BI Organizational Data Types licensing requirements

Note: Currently requires English added as an editing language (more languages coming soon).

Watch the Video

Subscribe YouTube

Try Power BI Organizational Data Types in Excel - Download Workbook

Enter your email address below to download the sample workbook.

By submitting your email address you agree that we can email you our Excel newsletter.
Please enter a valid email address.

Download the Excel Workbook and try them yourself. Note: This is a .xlsx file please ensure your browser doesn't change the file extension on download.

Setting Up Power BI Organizational Data Types

  1. Create data either in Excel or use data from another database. My example data is in an Excel workbook saved on SharePoint. I then imported it into Power BI Desktop using Power Query. See this tutorial for getting files from SharePoint with Power query.

Power BI Desktop

Once you've imported your data to Power BI Desktop there's a little set up to do:

  1. Go to the Model View > Table Properties – turn on ‘Is featured table’:
  2. Power BI featured table

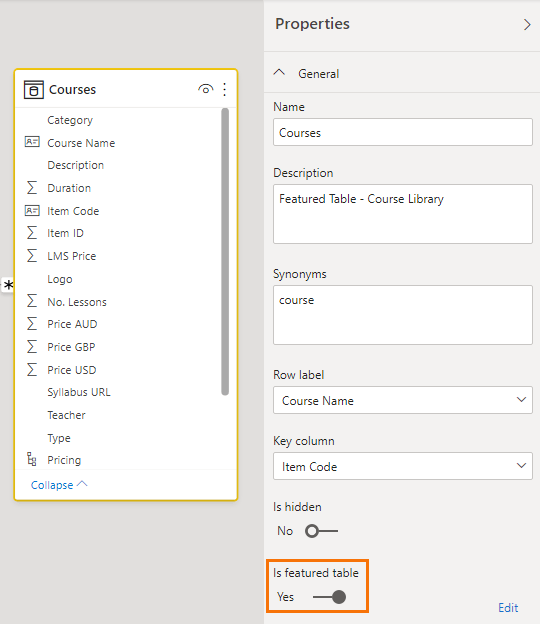
    At the dialog box (shown below) give your featured table a description. If you start the description with "Featured table" it will help Power BI report creators identify it.

    Power BI featured table row label and key column

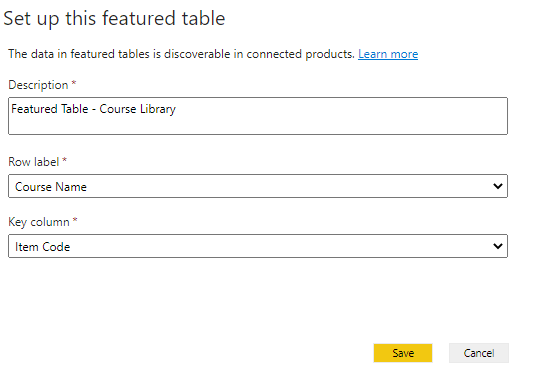
    The Row label field is used in Excel so users can easily identify the row. It appears as the cell value for a linked cell in the Data Selector pane, and in the Information card.

    The Key column field value provides the unique ID for the row. This value enables Excel to link a cell to a specific row in the table.

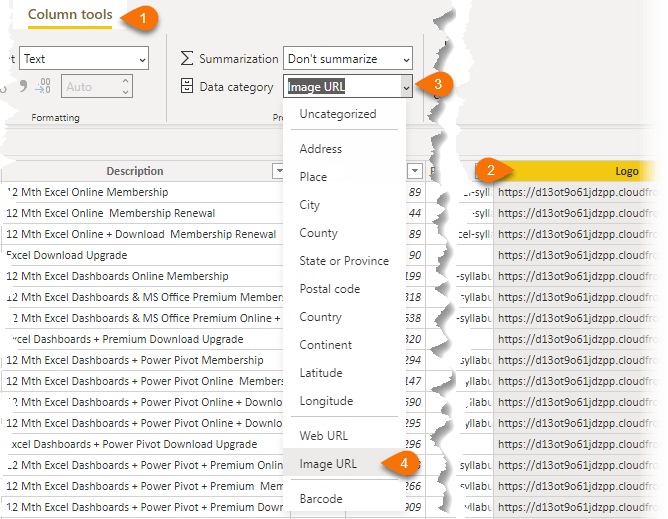
  1. In the Data view > Column tools tab set the data category for any URL fields you have. I’ve got a Web URL for the syllabuses and an Image URL for the course logos:
  2. Power BI data categories

  1. Save the Power BI Desktop file
  2. Publish to Power BI Service:
  3. Publish Power BI file

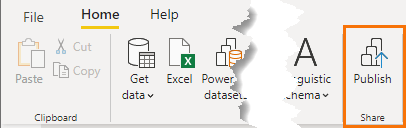
Note: make sure you choose a Modern Workspace when publishing.

Power BI Service

In the Power BI service, we set permissions and refresh capabilities.

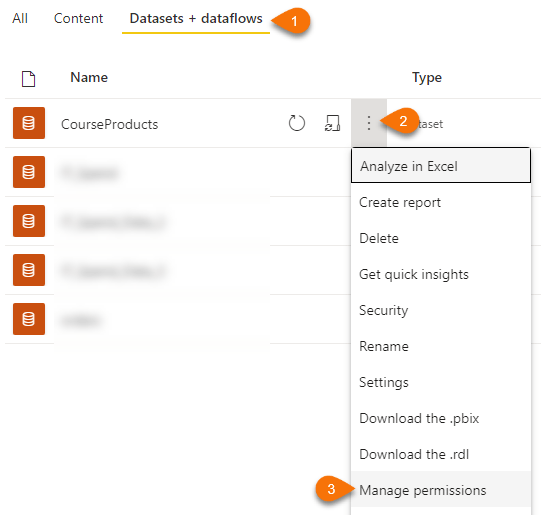
  1. Give users access: Open the Dataset Settings: Add users or groups to the dataset:
  2. Power BI dataset settings

  3. Set up the Data Source Credentials so your data can be refreshed:
  4. Power BI data source credentials

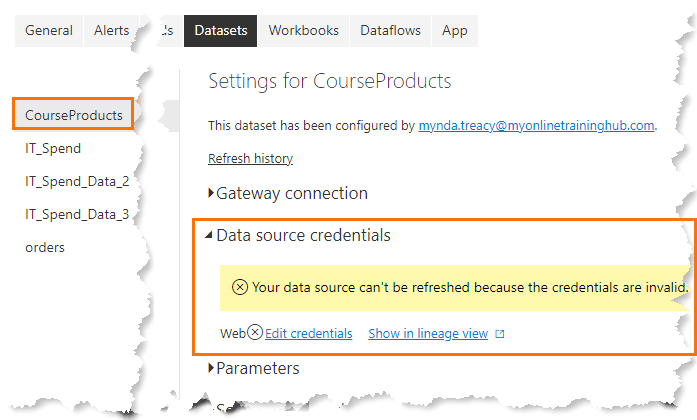
Note: if your data isn’t stored in the cloud you’ll need to set up the Gateway connection (see option above ‘Data source credentials’ in the image above).

Excel

  1. Restart Excel: before you can access the organizational data types you must restart Excel as it caches data types.
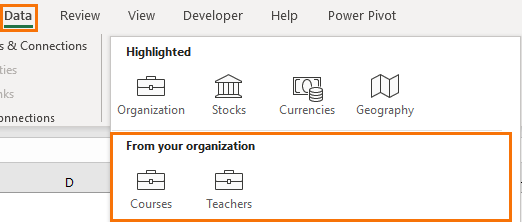
  2. Open Excel again and you should see your organizational data types in the Data Type gallery:
  3. Power BI Organizational Data Types in Excel

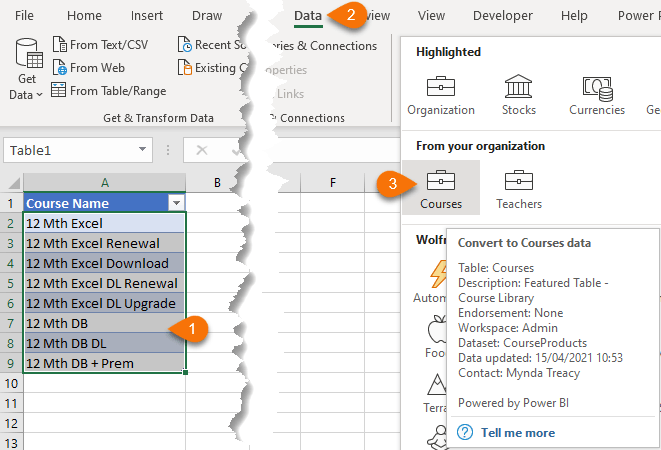
  4. Select the cells containing the values for the data types (in my example it’s the course names), then click the relevant organizational data type from the data type gallery:
  5. Excel Organizational Data Types

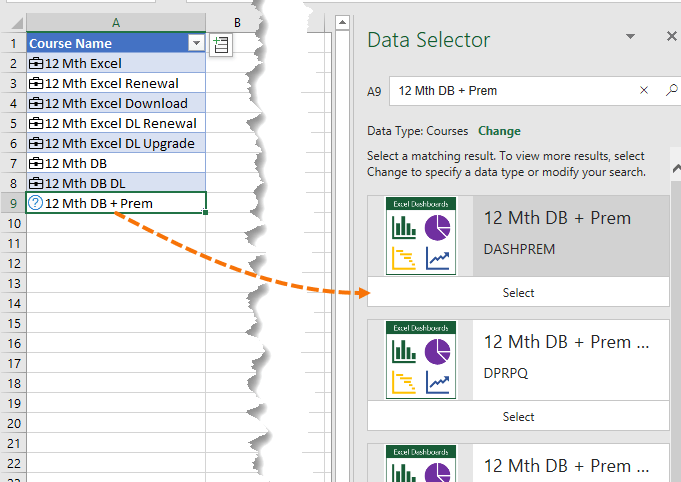
If there are any ambiguities the Data Selector pane will open and you can choose the correct match from the list:

Excel Data Type Selector

More on Data Types

Power Query Custom Data Types – Includes tips for referencing data types in formulas and more.

Built in Data Types - Stocks, Currency and Geography.

Power BI Organizational Data Types

More Power BI Posts

custom tooltips in power bi

Custom Tooltips in Power BI

Create custom tooltips for Power BI visuals. Use charts, images, numeric or categorical data to enhance the information your visuals convey
conditional formatting tables and matrices in power bi

Conditional Formatting in Power BI Tables and Matrices

How to apply conditional formatting to tables and matrices in Power BI. Use color, icons, data bars and URL's.
dax editor keyboard shortcuts

DAX Editor Keyboard Shortcuts

Keyboard shortcuts for the DAX editor in Power BI. Learning DAX is hard enough. Make your life easier by using these keyboard shortcuts.
fixing incorrect totals in dax

Fixing Incorrect Totals in DAX

If you're getting incorrect totals in your DAX measures, this post explains how to fix them. VIDEO and Sample file to download.
highlighting data in power bi visuals

Highlighting Data in Power BI Visuals

Learn several techniques to highlight or label important data points in your Power BI visuals. Sample file and code to download.
shape maps in power bi

Shape Maps in Power BI

Shape maps in Power BI can be used to show the distribution of a variable across geographic regions. Learn a trick to plot discrete data too.
static data tables

Static Tables in Power Query, Power Pivot and Power BI

Use static tables to store data in Power Query, Power Pivot and Power BI without needing to load data from an external source

Converting Decimal Time to Days, Hours, Minutes, Seconds in Power BI

Convert times and durations from decimal numbers to easily understood formats like hh:mm:ss. Sample code and file to download.
Power BI Dashboards

How to Build Power BI Dashboards

This video tutorial takes you step by step through building Power BI dashboards and reports, including publishing and sharing.


Category: Power BI
Previous Post:shape maps in power biShape Maps in Power BI
Next Post:Secrets to Building Excel Dashboards in Under 15 Minutes

Reader Interactions

Comments

  1. Santchev

    July 23, 2021 at 5:11 am

    Hey Myanda hope you doing well.

    I have been the steps but my organizational data type don’t appear in excel.
    I have Office 365 Business and Power Bi licence.
    I d’on’t know actually what’s going wrong or if i maybe missed something. I really need to use this data type function, this will help save many hours and work more efficiently.

    Need your help!

    Reply
    • Mynda Treacy

      July 23, 2021 at 11:39 am

      Have you restarted Excel? Also, you must be logged into Excel and Power BI with the same account. If you’re still having problems then you’ll need to reach out to Microsoft support.

      Reply

Leave a Reply Cancel reply

Your email address will not be published. Required fields are marked *

Current ye@r *

Leave this field empty

Sidebar

More results...

Featured Content

  • 10 Common Excel Mistakes to Avoid
  • Top Excel Functions for Data Analysts
  • Secrets to Building Excel Dashboards in Less Than 15 Minutes
  • Pro Excel Formula Writing Tips
  • Hidden Excel Double-Click Shortcuts
  • Top 10 Intermediate Excel Functions
  • 5 Pro Excel Dashboard Design Tips
  • 5 Excel SUM Function Tricks
  • 239 Excel Keyboard Shortcuts

100 Excel Tips and Tricks eBook

Download Free Tips & Tricks

Subscribe to Our Newsletter

Receive weekly tutorials on Excel, Power Query, Power Pivot, Power BI and More.

We respect your email privacy

Guides and Resources

  • Excel Keyboard Shortcuts
  • Excel Functions
  • Excel Formulas
  • Excel Custom Number Formatting
  • ALT Codes
  • Pivot Tables
  • VLOOKUP
  • VBA
  • Excel Userforms
  • Free Downloads

239 Excel Keyboard Shortcuts

Download Free PDF

Free Webinars

Excel Dashboards Webinar

Watch our free webinars and learn to create Interactive Dashboard Reports in Excel or Power BI

Click Here to Watch Now

mynda treacy microsoft mvpHi, I'm Mynda Treacy and I run MOTH with my husband, Phil. Through our blog, webinars, YouTube channel and courses we hope we can help you learn Excel, Power Pivot and DAX, Power Query, Power BI, and Excel Dashboards.

Blog Categories

  • Excel
  • Excel Charts
  • Excel Dashboard
  • Excel Formulas
  • Excel PivotTables
  • Excel Shortcuts
  • Excel VBA
  • General Tips
  • Online Training
  • Outlook
  • Power Apps
  • Power Automate
  • Power BI
  • Power Pivot
  • Power Query
microsoft mvp logo
trustpilot excellent rating
Secured by Sucuri Badge
MyOnlineTrainingHub on YouTube Mynda Treacy on Linked In Mynda Treacy on Instagram Mynda Treacy on Twitter Mynda Treacy on Pinterest MyOnlineTrainingHub on Facebook
 

Company

  • About My Online Training Hub
  • Disclosure Statement
  • Frequently Asked Questions
  • Guarantee
  • Privacy Policy
  • Terms & Conditions
  • Testimonials
  • Become an Affiliate

Support

  • Contact
  • Forum
  • Helpdesk – For Technical Issues

Copyright © 2023 · My Online Training Hub · All Rights Reserved. Microsoft and the Microsoft Office logo are trademarks or registered trademarks of Microsoft Corporation in the United States and/or other countries. Product names, logos, brands, and other trademarks featured or referred to within this website are the property of their respective trademark holders.