• Skip to main content
  • Skip to header right navigation
  • Skip to site footer

My Online Training Hub

Learn Dashboards, Excel, Power BI, Power Query, Power Pivot

  • Courses
  • Pricing
    • Free Courses
    • Power BI Course
    • Excel Power Query Course
    • Power Pivot and DAX Course
    • Excel Dashboard Course
    • Excel PivotTable Course – Quick Start
    • Advanced Excel Formulas Course
    • Excel Expert Advanced Excel Training
    • Excel Tables Course
    • Excel, Word, Outlook
    • Financial Modelling Course
    • Excel PivotTable Course
    • Excel for Customer Service Professionals
    • Excel for Operations Management Course
    • Excel for Decision Making Under Uncertainty Course
    • Excel for Finance Course
    • Excel Analysis ToolPak Course
    • Multi-User Pricing
  • Resources
    • Free Downloads
    • Excel Functions Explained
    • Excel Formulas
    • Excel Add-ins
    • IF Function
      • Excel IF Statement Explained
      • Excel IF AND OR Functions
      • IF Formula Builder
    • Time & Dates in Excel
      • Excel Date & Time
      • Calculating Time in Excel
      • Excel Time Calculation Tricks
      • Excel Date and Time Formatting
    • Excel Keyboard Shortcuts
    • Excel Custom Number Format Guide
    • Pivot Tables Guide
    • VLOOKUP Guide
    • ALT Codes
    • Excel VBA & Macros
    • Excel User Forms
    • VBA String Functions
  • Members
    • Login
    • Password Reset
  • Blog
  • Excel Webinars
  • Excel Forum
    • Register as Forum Member

Non-financial Excel Dashboards

You are here: Home / Excel Dashboard / Non-financial Excel Dashboards
May 20, 2021 by Mynda Treacy

Dashboards give a visual snapshot of your business performance. They typically show data spread over time and grouped by category. The most common dashboard examples are based on financial data, so in this video tutorial I’ll show you how to build non-financial Excel dashboards.

I’ll be including some techniques I haven’t demoed in any of my other dashboard tutorials so stay tuned to the end.

non-financial excel dashboards

This dashboard uses Power Query and Power Pivot which are available in Excel 2010 onward. However, there are some limitations depending on the version of Excel that you have. Click the links below to see if your version of Excel is compatible:

  • Versions of Excel supporting Power Query
  • Versions of Excel supporting Power Pivot

Watch the Video

Subscribe YouTube

Download Workbook and Data

Enter your email address below to download the sample workbook and data.

By submitting your email address you agree that we can email you our Excel newsletter.
Please enter a valid email address.

Download the Excel workbook and data files follow along. Note: This is a .zip file. You need to unzip the data once downloaded.

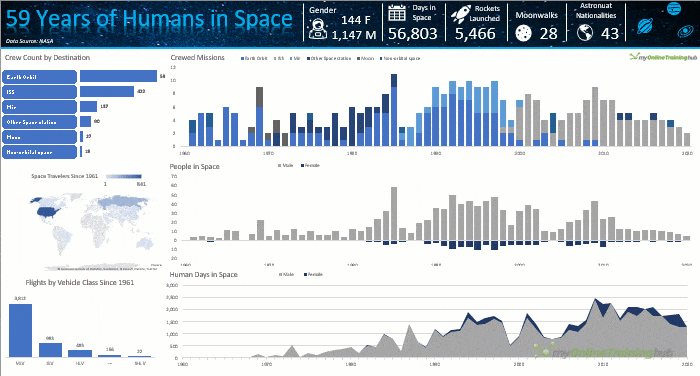
Techniques Used to Build Non-financial Excel Dashboards

  • Power Query - get the data from the Text/CSV files
  • Power Pivot – model the data and write DAX measures
  • PivotTables – to summarise the data for the charts
  • Pivot Charts – to visualise your data
  • Cross Highlighting and Filtering Charts – like we can with Power BI, but in Excel!
  • Slicers – allow filtering of the charts
  • Icons – add graphics to help quick interpretation
  • Map Charts – Excel Map charts use Bing maps to plot data
  • TEXT Function – create dynamic labels that update with your reports
  • Custom Number Formatting – to hide the negative values in the People in Space chart
  • Microsoft 365 Stock Images – Royalty-free images for use in documents, presentations, workbooks etc.

Learn More

The topics above are a great start, but if you’d like to take your Excel skills further, please consider our courses below:

Excel Dashboards Course – A comprehensive course designed to give you the skills to build dashboards for any industry.

Excel Power Query Course – automate the gathering and cleaning of data with Power Query.

Power Pivot Course - work with big data spread over multiple tables. Create relationships between the tables and write advanced DAX measures that extend the capabilities of regular PivotTables.

More Excel Dashboard Posts

excel infographic tools

Excel Infographic Tools

Excel infographic tools are many and varied. In this tutorial I take you through step by step building an Excel infographic.
ai dashboard design

AI Dashboard Design

AI dashboard design can give you some great ideas for design and color combinations, but it’s not smart enough to create useful reports…yet!
dark theme dashboards

Dark Themed Excel Dashboards

Dark Themed Excel Dashboards enable you to use formatting techniques that make your data pop and get your audience's attention.
excel dashboards custom backgrounds

Custom Excel Dashboard Backgrounds

Custom Excel Dashboard Backgrounds bring a level of polish and professionalism to reports and they’re super easy to create using PowerPoint

Embedding Excel Dashboards in a Web Page

Embedding Excel Dashboards in a Web Page from files on SharePoint or OneDrive for Business or OneDrive Personal.
excel student performance dashboard

Excel Student Performance Dashboard

How to build an Excel student performance dashboard from scratch. Download the completed Excel file for reference.
5 Pro excel dashboard design tips

5 Pro Excel Dashboard Design Tips

Excel Dashboard Design Tips you can use in both Excel and Power BI to ensure your reports and quick and easy to read.
excel interactive personal finance dashboard

Interactive Personal Finance Dashboard

Excel Interactive Personal Finance Dashboard to help you visualise and keep track of and manage where you’re spending your money.

Secrets to Building Excel Dashboards in Under 15 Minutes

Learn how to build interactive, clean and focussed dashboards that communicate the important information you want readers to know.
personal share portfolio dashboard

Personal Stock Portfolio Dashboard

Monitor your stocks with this personal share portfolio dashboard built with Excel using the refreshable STOCKHISTORY function and data types.


Category: Excel Dashboard
Previous Post:extract characters from strings in power query using text select and text extractExtract Letters, Numbers, Symbols from Strings in Power Query with Text.Select and Text.Remove
Next Post:Handling HTTP Errors in Power Query and Power BIhandling http errors in power query and power bi

Reader Interactions

Comments

  1. nawal

    June 9, 2022 at 4:34 pm

    Hi,
    i would need help on creating dashboard for KRI that been collect for 3 years. i am not good in excel and not able to get it done. please help

    Reply
    • Mynda Treacy

      June 10, 2022 at 9:52 am

      Hi Nawal,

      Please reach out via email: website at MyOnlineTrainingHub.com and we can refer you to a consultant who can help.

      Mynda

      Reply

Leave a Reply Cancel reply

Your email address will not be published. Required fields are marked *

Current ye@r *

Leave this field empty

Sidebar

More results...

Featured Content

  • 10 Common Excel Mistakes to Avoid
  • Top Excel Functions for Data Analysts
  • Secrets to Building Excel Dashboards in Less Than 15 Minutes
  • Pro Excel Formula Writing Tips
  • Hidden Excel Double-Click Shortcuts
  • Top 10 Intermediate Excel Functions
  • 5 Pro Excel Dashboard Design Tips
  • 5 Excel SUM Function Tricks
  • 239 Excel Keyboard Shortcuts

100 Excel Tips and Tricks eBook

Download Free Tips & Tricks

Subscribe to Our Newsletter

Receive weekly tutorials on Excel, Power Query, Power Pivot, Power BI and More.

We respect your email privacy

Guides and Resources

  • Excel Keyboard Shortcuts
  • Excel Functions
  • Excel Formulas
  • Excel Custom Number Formatting
  • ALT Codes
  • Pivot Tables
  • VLOOKUP
  • VBA
  • Excel Userforms
  • Free Downloads

239 Excel Keyboard Shortcuts

Download Free PDF

Free Webinars

Excel Dashboards Webinar

Watch our free webinars and learn to create Interactive Dashboard Reports in Excel or Power BI

Click Here to Watch Now

mynda treacy microsoft mvpHi, I'm Mynda Treacy and I run MOTH with my husband, Phil. Through our blog, webinars, YouTube channel and courses we hope we can help you learn Excel, Power Pivot and DAX, Power Query, Power BI, and Excel Dashboards.

Blog Categories

  • Excel
  • Excel Charts
  • Excel Dashboard
  • Excel Formulas
  • Excel PivotTables
  • Excel Shortcuts
  • Excel VBA
  • General Tips
  • Online Training
  • Outlook
  • Power Apps
  • Power Automate
  • Power BI
  • Power Pivot
  • Power Query
microsoft mvp logo
trustpilot excellent rating
Secured by Sucuri Badge
MyOnlineTrainingHub on YouTube Mynda Treacy on Linked In Mynda Treacy on Instagram Mynda Treacy on Twitter Mynda Treacy on Pinterest MyOnlineTrainingHub on Facebook
 

Company

  • About My Online Training Hub
  • Disclosure Statement
  • Frequently Asked Questions
  • Guarantee
  • Privacy Policy
  • Terms & Conditions
  • Testimonials
  • Become an Affiliate

Support

  • Contact
  • Forum
  • Helpdesk – For Technical Issues

Copyright © 2023 · My Online Training Hub · All Rights Reserved. Microsoft and the Microsoft Office logo are trademarks or registered trademarks of Microsoft Corporation in the United States and/or other countries. Product names, logos, brands, and other trademarks featured or referred to within this website are the property of their respective trademark holders.