
Excel just turned 40, and over the decades it has introduced features that completely changed the way we work with data. While there have been hundreds of updates, four stand out as truly game-changing. These innovations not only saved time but also reshaped how professionals around the world analyse and present information.
In this article, we’ll explore the four most important Excel features ever released, one from each decade, along with examples of how you can use them today.
Table of Contents
- Watch the Video
- Get the Practice Files
- 1. PivotTables: The Original Excel Reporting Tool (1990s)
- 2. Excel Tables: Smarter Data Management and Automation (2000s)
- 3. Power Query: Excel’s Data Automation Tool (2010s)
- 4. Dynamic Arrays: Modern Excel Formulas for Data Analysis (2020s)
- Why These Features Matter Together
- Final Thoughts
Watch the Data Analysis without Formulas Video

Get the Practice Files
Enter your email address below to download the free file.

1. PivotTables: The Original Excel Reporting Tool (1990s)
When Microsoft introduced PivotTables in 1993, it gave users the ability to summarise and analyse data at lightning speed. Instead of manually creating complex formulas, PivotTables allow you to drag and drop fields into rows, columns, filters, and values to generate instant reports.
Why PivotTables are essential:
- Summarise thousands of rows of raw data in seconds.
- Calculate totals, percentages, and averages without writing formulas.
- Filter and slice data dynamically.
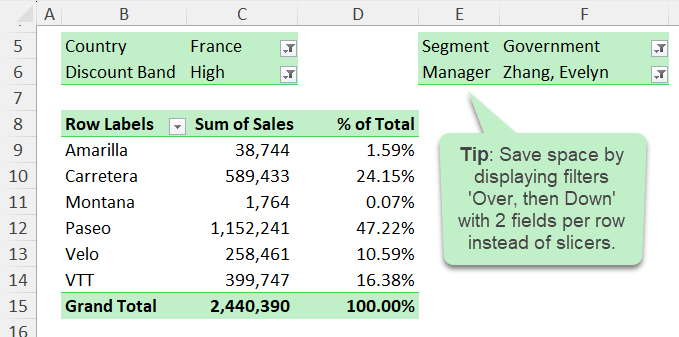
Pro tip: Instead of cluttering your worksheet with multiple slicers, you can add fields to the Filters area and adjust the layout. By setting filter fields to display “Over, then Down” and increasing the number of filters per row, you can create a compact, professional report layout:
👉 Even today, PivotTables remain one of the most powerful tools for fast, flexible data analysis.
🎓 Click here to get up to speed with PivotTables.
2. Excel Tables: Smarter Data Management and Automation (2000s)
In 2007, Excel introduced Tables, an upgrade to the older “Lists” feature. What seemed like a cosmetic change quickly became one of the most important tools for ensuring data integrity.
Key benefits of Excel Tables:
- Automatic expansion: Tables automatically grow as you add new rows or columns.
- Structured references: Formulas become easier to read (e.g., =SUM(Table1[Sales]) instead of =SUM(C2:C100)).
- Built-in features: Filtering, sorting, and total rows are enabled by default.
- Seamless formatting: Apply built-in or custom styles for clean, consistent reports.
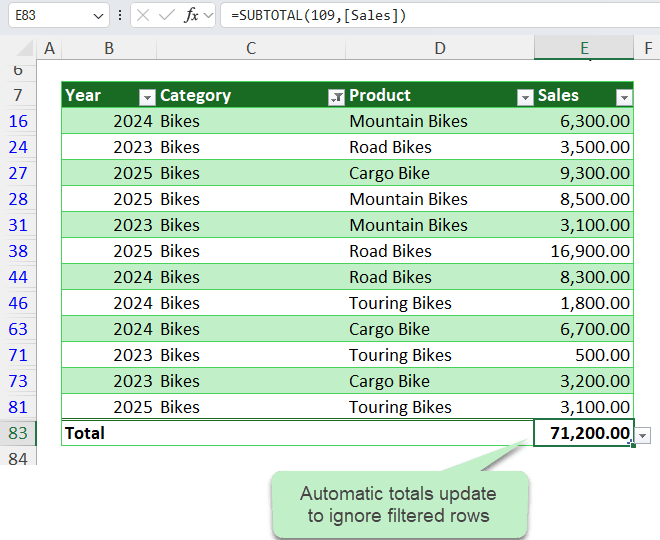
Pro tip: Use the AGGREGATE function at the top of your table for totals that update automatically and ignore filtered rows. For example:
=AGGREGATE(9,1,Table1[Sales])
Use Slicers to enable users to quickly and easily filter the table.
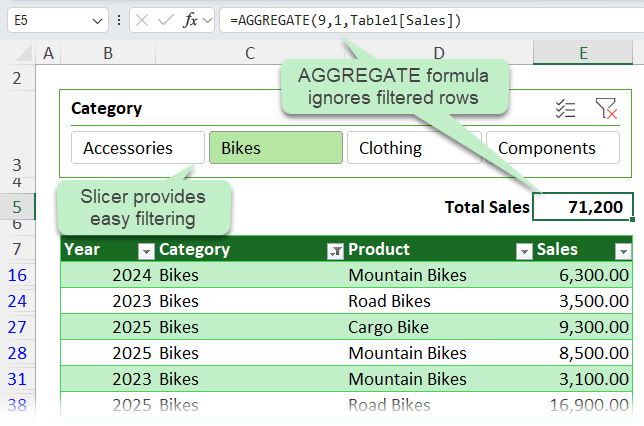
This gives you a dynamic, always-visible total that updates with your filters.
👉 Excel Tables aren’t just about formatting - they’re about building reports that stay accurate as your data changes.
🎓 Click here to get up to speed with Excel Tables.
3. Power Query: Excel’s Data Automation Tool (2010s)
Released in 2010 as an add-in, Power Query (now built into Excel) revolutionised how we import, clean, and transform data. For anyone who deals with repetitive reporting tasks, this feature is a game-changer.
What makes Power Query powerful:
- Automates repetitive tasks: Once you define a query, you can reuse it every month with a single refresh.
- Handles large data sets: Merge multiple files or databases into one clean dataset.
- No coding required: Use a point-and-click interface to apply transformations.
- Keeps a full audit trail: Every step is recorded and can be adjusted later.
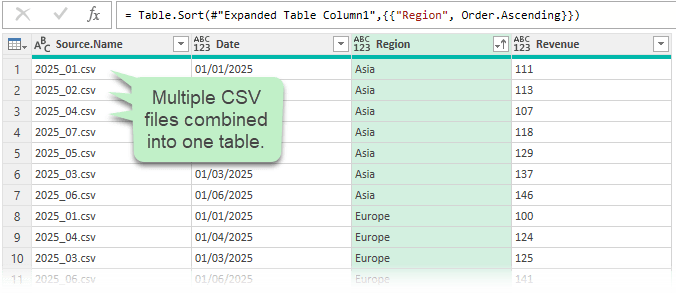
Example: If you receive monthly sales reports as CSV files, Power Query can automatically combine them into a single table. Drop the new file in the folder, click Refresh, and your reports update instantly.
🎓 Click here to get started automating boring tasks with Power Query.
👉 Power Query turned Excel into a true ETL (Extract, Transform, Load) tool for analysts - no need for VBA or third-party software.
Ready to go beyond the basics?
Check out my Excel courses and learn how to combine these features into powerful, real-world solutions.
4. Dynamic Arrays: Modern Excel Formulas for Data Analysis (2020s)
The most recent breakthrough is Dynamic Arrays, which were generally available to 365 users in 2020. Before this, formulas could only return a single result per cell (unless you used complex array formulas and used the secret keyboard shortcut CTRL+SHIFT+ENTER to insert them). Now, one formula can spill results across multiple cells automatically.
Dynamic Array functions include but not limited to:
- UNIQUE – extract distinct values.
- SORT – organise results instantly.
- FILTER – return only the rows that meet your criteria.
- SEQUENCE – generate number patterns.
- PIVOTBY – create pivot-like summaries with a single formula.
Example: Build a sales summary by year and category without helper columns or PivotTables:
=SUMIFS(Table3[Sales], Table3[Year], G4#, Table3[Category], H3#)
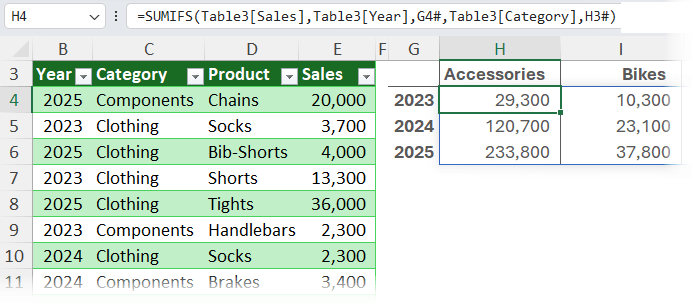
When new data is added, the formulas expand automatically.
With the PIVOTBY function, you can even generate an entire pivot-style report using one formula:
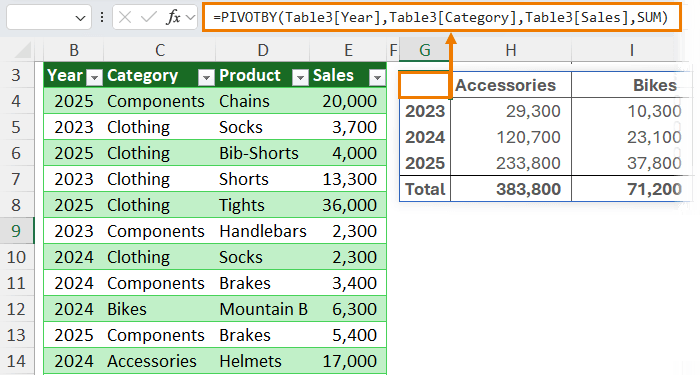
👉 Dynamic Arrays reduce complexity, eliminate unnecessary formulas, and make reporting more scalable.
🎓 Click here to get started with Dynamic Arrays.
Why These Features Matter Together
Individually, each of these features is powerful. But the real magic happens when you combine them:
- Use Power Query to clean and load your data.
- Store it in an Excel Table for integrity and easy referencing.
- Analyse it with PivotTables or Dynamic Arrays for flexible summaries and dashboards like this:
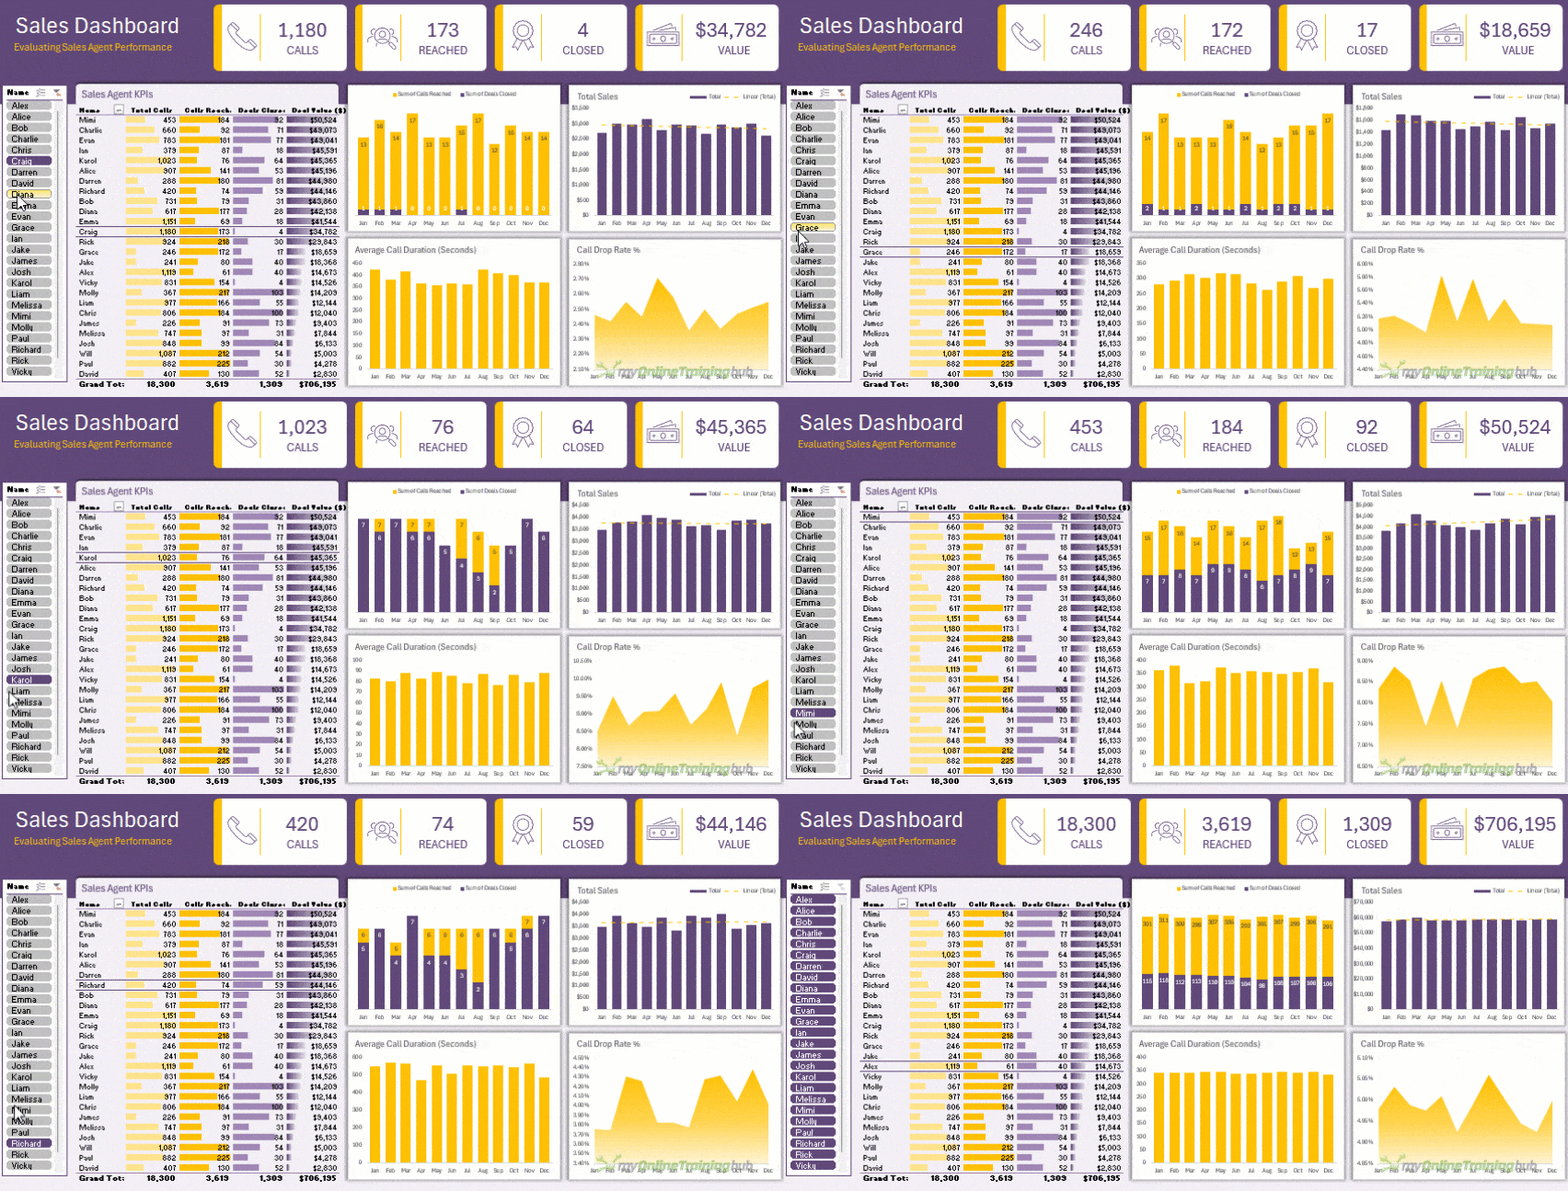
This workflow turns Excel into a self-updating, professional reporting system that saves hours every week.
Final Thoughts: Must-Know Excel Features for Professionals
You’ve just seen how PivotTables, Tables, Power Query, and Dynamic Arrays can transform the way you work in Excel. Imagine what you could achieve when you bring them all together, confidently, efficiently, and with expert guidance.
👉 Take the next step today with one of my Excel & Power BI courses. You’ll gain hands-on experience, practical projects, and expert support mentoring that will turn you into the Excel professional everyone relies on.