Reporting on plan v actual variances can be a very dry topic and often the audience for these reports are not from a financial background.
To aid business management, we can create visually appealing interactive reports like the plan v actual Excel dashboard below.
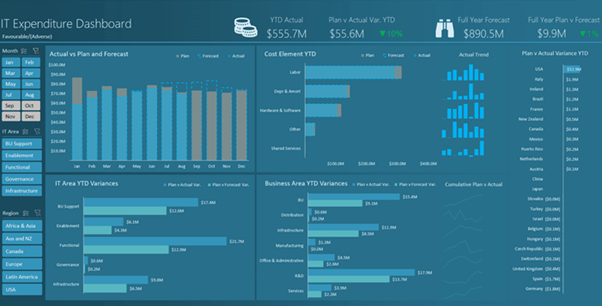
It needn’t be a lot of work either. This dashboard can be constructed in just over 30 minutes, as demonstrated step by step in the video below. And once built, it can be updated with the click of one button!
Watch the Video

Download Workbook
Enter your email address below to download the sample workbook.

Plan v Actual Excel Dashboard Techniques Used
I used several techniques to build this dashboard and you’ll find links to the individual tutorials on these topics below:
- Excel Tables
- PivotTables
- GETPIVOTDATA function
- Pivot Charts
- Slicers
- TEXT function
- Conditional Formatting with Formulas
- Custom Number Formats
- Excel Icons
Learn More
The topics above are a great start, but if you’d like to take your Excel skills further, please consider our courses below:
Excel Dashboards Course – A comprehensive course designed to give you the skills to build dashboards for any industry.
Excel PivotTable Quick Start – this course will help you overcome your fears and challenges with building PivotTables. It’ll have you up and running in under 2 hours.
Excel Advanced Formulas - I’ve designed this course to get you quickly up to speed with the functions that are going to give you the biggest efficiency gains. Many of the functions are considered advanced, but when you’ve finished the course, you’ll know like I do, that everything is easy once you know how.
Excel Expert Course – This course includes the PivotTable Quick Start and Advanced Formulas course as well as a load more topics covering everything from beginner topics (which you can skip if you already know them) to more advanced topics.
Power BI Course - Power BI offers functionality we can only dream of in Excel. Including secure sharing of reports on any device, clickable chart elements that cross filter and highlight other charts, and much more.


Hello,
Would you be able to do one for grants where there is a fixed budget and expenses throughout the year (no generation of income). If possible linking 5 grants for one dashboard.
Thanks for the suggestion. I don’t have any plans for this, but you can certainly modify this dashboard to suit your needs.
always neat lectures.. I’m excited to go back and practice the basic excel tricks to create dashboards and then power things up.
Great to hear!
Hello , my name Harry from Indonesian student, i have office 2016 in my PC desktop, can i use Excel 2016 to learning Plan v Actual Excel Dashboard , i want try to follow your video in Excel 2016.
Thanks for advice
Regards,
Harry
Hi Harry, Yes, you can build this dashboard with Excel 2016.
Hi,
How do you link slicer connection if i have more than 2 data table sources?
Hi Paul,
If you have multiple source tables then you must use Power Pivot (the data model) and create relationships between the tables (usually via a dimension table). If you’d like to learn how to use Power Pivot, please consider my Power Pivot course.
Mynda
Hi,
Exactly what I need but am not sure how to go forward with this. What if the plan is based on COA mapping. So let’s say for the whole year, you have a budget of 100k on Cleaning and 50k on Cleaning Consumables. In January, you receive an invoice from supplier for Cleaning and for a period of 3 months (quarterly) and 3 invoices for Consumables (varies every month). What is the easiest way divide/split yearly budget each month on that sheet? I think I missed that information on your video. Would be nice how if you can show the input on the Data tab., Thanks.
Hi Geneve,
My data is already split by month, so there is no need to do this in the tutorial. If your budget is rolled up to the total value for the year then you can use Power Query to split it. I don’t have any blog posts I can point you to, but I cover this in my Power Query Course.
Mynda
Can you provide supply chain dashboard?
I don’t have any supply chain dashboards, sorry. If you have some data I can use then I can try to make one as an example tutorial.
you have done nicely
Glad it was helpful, Henok!
Very cool.
Glad you liked it, Roy!
I have the data. Would you or your team build a dashboard or is that something that you guys do not do?
Hi Matthew, I don’t do consulting, but I’ll email you with the contact details for a consultant who can help.
How can I download actual excel workbook? I can’t se the link
When you enter your email address the download link becomes available on the page.
Not able to down load the Excel data file? How do I get it?
Hi Ramesh, you enter your email address to reveal the download links on this page.
Excellent course, short but comprehensive and direct to the point, well done and appreciated.
Glad it was useful, Salah!
Hi,
As a financial controller, I am looking for a file that can help me for my month end closing.
Typically, once the accounting team have performed their entries, I am downloading the actuals periodically and year to date. From this, I am then inserting the data as Pivot Table to understand the trends BU per BU or Account by account, company by company etc…This is the step when I am reviewing my accruals, and see if there could be a missing accrual or an entry to reclass etc..
Ideally, I have seen once a kind of Pivot (fully loaded of VBA) that enabled to insert value in an inserted column of a pivot that was then updating its own database.
(E.G: You manually input 10€ in the pivot column and this creates the right reference line in the database).
Do you have a similar way to proceed something like that (using a pivot as visualizing but active tool as well when you aiming to insert Forecast also for instance) ?
Hi Simon,
I don’t have any templates that would allow you to enter a value into a PivotTable and then update a database, sorry. This sounds like a bespoke application that someone has developed for this specific purpose.
Mynda
Thank you for all the help.
This is much appreciated.
Glad it was helpful, Peter!
If you only knew how long I have been trying to learn this. You make it to the point and easy to learn. Thanks so much and Merry Christmas
So pleased you found it helpful, John!
Many thanks it is really helpful, clear and fast to apply 🙂
Great to hear, Frederic!
This is a great video. Exactly what I was looking for. You are inspiring me to do a dashboard course.
Great to hear, Irina! Please consider my Excel Dashboard course.
This course is awsome! Thank You very much for all your knowleadge!!!
So pleased you enjoyed it, Marina!
Great videos! So glad I found you all. Have you ever done a tutorial on doing a zero based budget template for a corporations? ZBB is making a come back and not a lot out there on using it in a larger scale, just for personal finances.
Thanks, Adonna! I haven’t done anything on zero based budgeting. Back in my investment banking days that was a big part of my role, but I haven’t done any budgeting for a long time! I’d have thought it would be very difficult to build a one size fits all template for budgeting as it’s so unique to each business.
Hi
Just saw your video on YouTube..it was nice..!!awesome..!!
Can it be published to web so that end user can access the dashboard easily ?
So pleased to hear you found the video helpful! You can use the Excel WebApp to embed the Dashboard in a web page.
That is great
Glad you found it useful 🙂
Hi Mynda
Another great post, so well presented. Thanks for your helpful tutorials!
One request – would you be able to fix the link to the excel file so I can download it?
Thanks, Monica! There’s nothing wrong with the link to the file. If you’re getting an error please get in touch via email (website at MyOnlineTrainingHub.com) so we can help you troubleshoot.
it’s a pretty good video.want to learn it.
Glad you enjoyed it, Klin 🙂
Awesome job as usual! I love your lightning speed!
Thanks so much, Ken!
When I enable editing, it does not allow me to save the dashboard to modify. Can you fix this?
Hi James, there’s no security on this file and you shouldn’t need to ‘enable editing’. I’m not sure why you’re seeing this message. Please get in touch via email (website at myonlinetraininghub.com) with screenshots of the process you followed to download the file and the messages you’re seeing so we can help troubleshoot.