Excel Dashboards may appear intimidating at first glance, but by mastering three simple steps, you'll be crafting interactive dashboards like the one below in no time.
And when you can update them with the click of a single button, they'll be sure to get you noticed and hopefully promoted.
If not, you'll have the skills to start looking for a job where you are appreciated!
Note: this example is based on sales data, but the techniques are the same no matter what data or industry you work in.
Table of Contents
Interactive Excel Dashboards in 3 Steps - Video

Download Practice File & Completed Dashboard
Don't let this be wasted Excel-entertainment. Skills aren't acquired by observing alone.
Download the Excel file containing the completed dashboard and the data so you can practice building this dashboard yourself.
Enter your email address below to download the sample workbook.

3-Step Excel Dashboards
The core components of building an interactive Excel dashboard quickly are:
Step 1 - Prepare your dashboard canvas:
- Set your colour theme.
- Apply background colours.
- Add a heading and subtitle with objective.
- Insert shape placeholders for KPIs.
- Add Icons to visually represent the KPIs
Step 2 - Analyse and visualise key metrics:
- Format data in an Excel Table for easy referencing and rapid updates.
- Use PivotTables to quickly summarise the data.
- Add Pivot Charts for fast interpretation.
Step 3 - Add interactive elements for data exploration:
- Slicers connected to PivotTables allow the user to filter and explore different views of the dashboard in an easy and intuitive way.
Next Steps
Automate gathering and cleaning your data: if you spend time on any of these tasks, then you're wasting valuable time:
- your data isn't in a ready to use tabular layout, so you spend time unpivoting it,
- you remove duplicates and or blank lines/columns, correct spelling, case, find and replace inconsistent data etc.
- you gather data from multiple files/sources and then spend time appending it into one table,
- you need to add calculations and columns,
- you spend time each week/month repeating these steps to update your reports.
Then check out Power Query to automate those boring and laborious tasks.
Here's what Ruth had to say about discovering Power Query:
Just wanted to say thanks again for recommending Power Query. I'm working on a job with some of the multiple outputs I mentioned previously, and it's saved several hours of compiling and eliminated the inevitable error from manual compiling (saving even more time). Then another several hours when the inevitable re-run just needs a hit of the re-fresh button.
Choose the right charts for your data and message: knowing which chart is going to suit your data and more importantly, convey your message quickly and clearly is essential.
I repeatedly see the same mistakes beginners and even experienced Excel users make when it comes to choosing which chart and chart elements (legend, labels, colours etc.) to use. They stand out a mile and undermine your work.
Just compare these charts below. One is a default Excel chart, and one is an Excel chart that's been enhanced to improve interpretation. I think you'll agree that one looks amateur, and one looks professional:
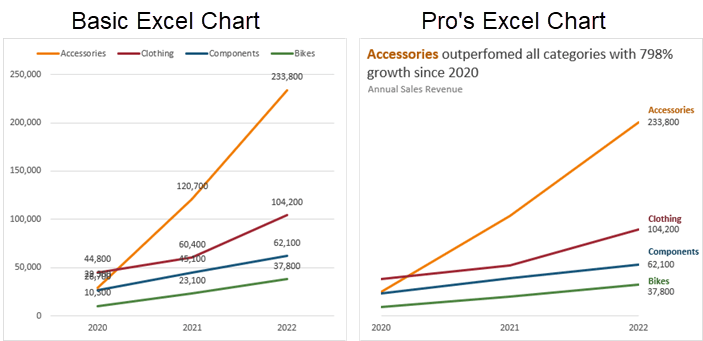
If you'd like to stand out amongst your peers with pro chart skills like this, check out my Excel Dashboard course.
Tip: you can get both the Power Query and Excel Dashboard course in a discounted bundle from the Excel Dashboard course page.

good website
Glad you found it helpful!
Cannot wait to see if this works
Have fun with it, Phil.
the file is protected
No, it’s not. What makes you think it’s protected?
Thank you for suggestions
Antonio
Hi Mynda,
I saw your video on how to make a dashboard in 3 steps: really very useful and educational. But I have a problem when I update the pivot table with formatting both with data bars and with icons (you know I tried to put the traffic lights …) the formatting of the columns with the icons is lost. I use the Mac version 16.90. How can I keep this formatting even after updating the data?
Many thanks for all the suggestions you want to give me.
Best regards Antonio
Hi Antonio,
PivotTables can only have conditional formatting automatically adjust with the PivotTable Value areas. You cannot apply it to row or column labels. If that doesn’t describe the issue you’re having, please post your question on our Excel forum where you can also upload a sample file and we can help you further.
There is more information on how to apply conditional formatting to PivotTables here.
Mynda