Excel functions are the backbone of a financial modeler’s day to day work and as such, it’s essential to have a good understanding of the functions that are commonly used to build financial models.
Below are the top Excel functions that you must know as a financial modeler grouped by area.
Are there any functions that you would include in your top 20 functions for financial modelers? Let me know in the comments.
Table of Contents
Watch the Video
For step by step and worked examples, watch the video below:

Download Example Workbook
Enter your email address below to download the file.
Standard Aggregating Functions
Standard aggregating functions are fundamental to almost all Excel work and are used to add up a range of numbers and find the total, minimum, maximum, average and count.
- SUM
- MIN
- MAX
- AVERAGE
- COUNT
These functions all take a range or multiple cells/values as their arguments. Using the SUM function as an example, the syntax is:
=SUM(value1,value2)
or
=SUM(range1, range2)
Note: The syntax is the same for the other functions listed above.
While these are some of the easiest functions in Excel’s library, there are some lesser known tricks for the SUM function you might want to check out here:

Conditional Aggregating Functions
Conditional aggregating functions enable you to specify criteria that must be met before a value is included in the aggregation.
They include:
These functions all take a range, criteria range and criteria as their arguments.Using the SUMIFS function as an example, the syntax is:
=SUMIFS(sum_range, criteria_range1, criteria1,...)
Note: The syntax is the same for the other functions listed above.
Logical Functions
Logical functions enable you to write ‘if’ statements where if one logical test is true, a calculation or value is returned, otherwise a different calculation or result is returned.
They are handy for modeling different scenarios and outcomes based on a range of assumptions.
The functions and their syntax in this section are:
IF Function
=IF(logical_test, value_if_true, value_if_false)
Nested IF Functions
=IF(logical_test, value_if_true,IF(logical_test, value_if_true, value_if_false))
IFS Function
=IFS(logical_test,value_if_true,logical_test2,value_if_true2...)
IF with AND Functions
=IF(AND(logical_test1,logical_test2…), value_if_true, value_if_false)
IF with OR Functions
=IF(OR(logical_test1,logical_test2…), value_if_true, value_if_false)

If you get stuck, use our IF formula builder and have your IF formulas written for you.
Lookup Functions
Lookup functions are used to look up a value in another table and return a corresponding value from the same row.
They can be used to create a reference table for financial modeling or bring data from one table into another.
For those with Excel 2021 or later, XLOOKUP should be your go-to lookup function. It overcomes the limitations of VLOOKUP and can do everything INDEX & MATCH can do.
Syntax:
=XLOOKUP(lookup_value, lookup_array, return_array, [if_not_found], [match_mode], [search_mode])

If you have an earlier version of Excel, I encourage you to use INDEX & MATCH as an alternative to XLOOKUP.

Financial Functions
There are a ton of financial functions in Excel which make easy work of calculating common financial metrics.
The financial functions listed below are some of the functions you’ll most commonly use as a financial modeler:
- PMT – Periodic Payment
- PV – Present Value
- NPV – Net Present Value
- IRR – Internal Rate of Return
Check out the video above for step-by-step examples of these functions.
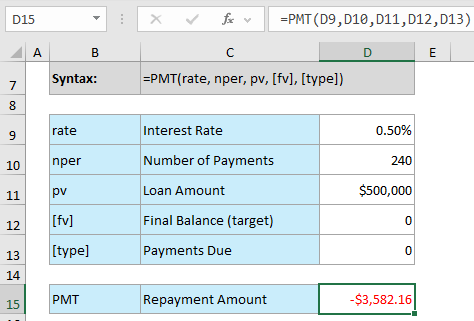
PMT Function
The PMT function is used to calculate the periodic payment for a loan or investment. It can be used to model debt repayments or investment returns in a financial model.
Syntax:
PMT(rate, nper, pv, [fv], [type])
The rate argument is the rate per payment period.
The nper argument is the number of payments made over the length of the loan. e.g. for a 20-year loan with monthly repayments there would be 240 payments
The pv argument is the principal or loan amount
The fv argument is optional. It represents the final balance of the loan or target. If omitted, zero is assumed.
The type argument is optional. It represents when payments are due. 0 = end of period , 1 = beginning of period. If omitted, zero is assumed.
*Note: results returned may differ from your bank, as there may be additional fees and taxes.
They may also calculate interest daily, or you may have an offset account etc.
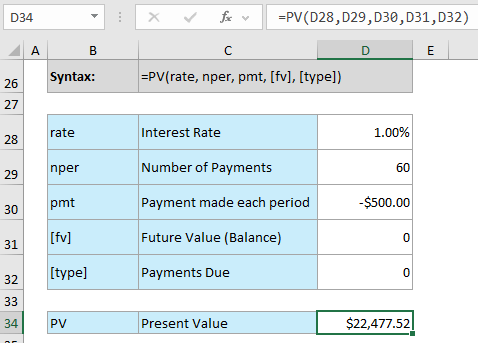
PV Function
The PV function calculates the present value of a future cash flow.
Syntax:
PV(rate, nper, pmt, [fv], [type])
The rate argument is the rate per payment period.
The nper argument is the number of payments made over the length of the loan. e.g. for a 5-year loan with monthly repayments there would be 60 payments
The pmt argument represents the payment made each period and cannot change over the life of the annuity.
The fv argument is optional. It represents the future value, or a cash balance you want to attain after the last payment is made.
The type argument is optional. 0 = end of period , 1 = beginning of period. If omitted, zero is assumed.
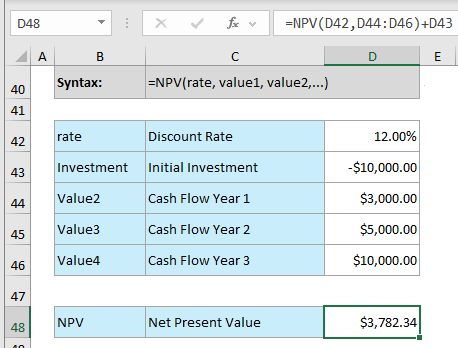
NPV Function
The NPV function is used to calculate the net present value of an investment based on a series of future cash flows.
It is a key function for discounted cash flow (DCF) analysis.
NPV assumes cash flows occur at the end of each period and requires them to be equally spaced. If not, use XNPV function.
Syntax: NPV(rate, value1, value2,...)
The rate argument is the rate of discount over the length of one period.
The value arguments represent the cash flows. Excel uses the order of value1, value2, ... to interpret the order of cash flows. Empty cells are ignored.
Note: if the initial investment occurs at the start of the investment period, do not include it in the vales as this should not be discounted. Instead, add it on outside the formula, as shown below.
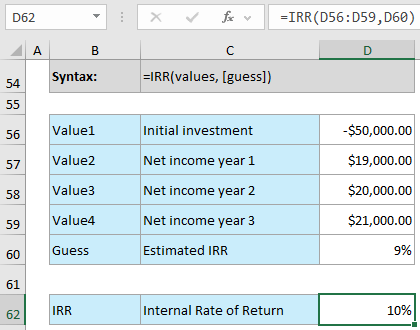
IRR Function
The IRR function is used to calculate the internal rate of return of an investment. It is another key function for DCF analysis.
Syntax: IRR(values, [guess])
Values is an array or a reference to cells that contain numbers for which you want to calculate the internal rate of return. They must contain at least one positive and one negative value.
IRR uses the order of values to interpret the order of cash flows. Therefore, you need to enter your payment and income values in the sequence you want.
The Guess argument is optional. It’s a number that you guess is close to the result of IRR. If omitted, it's assumed to be 10%.
Date Functions
Nearly all financial models are based on data over time. Below are few common date functions you’re likely to need:
- EOMONTH(start_date, months) – returns the last day of the month before or after a start date specified with a date serial number.
- EDATE(start_date, months) – rolls a date serial number forward or back based on the number of months specified in the 'months' argument.
- INTL(start_date, end_date, [weekend], [holidays]) - returns the number of whole workdays between two dates using parameters to indicate which and how many days are weekend days. Weekend days and any days that are specified as holidays are not considered as workdays.
Learn More Excel Functions for Financial Modeling
These functions are just a starting point. There are many other Excel functions that can be useful for financial modeling depending on the specific needs of your project.
For more on functions and formulas, check out my Advanced Excel Formulas course.
And if you want to take your Financial Modeling skills further, please consider our Financial Modeling course.


Creating a timeline for financial modellers is very important. So formulas for creating timelines such as EOMONTH etc must be clearly defined.
Yes! Good point. I linked to a comprehensive tutorial on EOMONTH above. It’s one of my favourite functions.
This was my first video on Youtube. I am so excited to learn more.
Thanks a lot
Awesome to hear!
Mynda you’re fastastic! Much thanks!
Glad you like it, Bemin
THANKS A LOT MYNDA
A VERY USEFUL INFORMATION
Great to hear, Miguel!