Hello everyone,
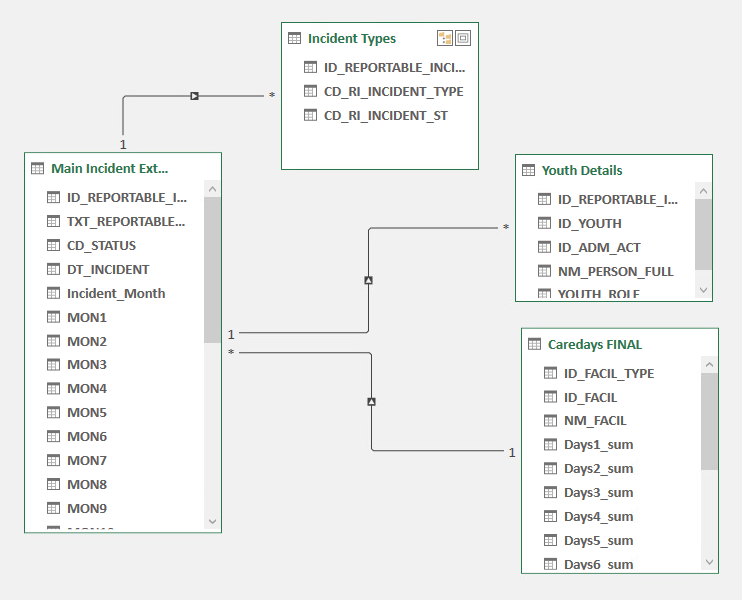
I created a data model using Power Query (see first attachment, "Data Model").

The model includes 4 tables:
- Main Incident Extract - This table includes one record for each unique incident that occurred at one of our facilities
- Incident Types - This table include one or more records for each incident. If, for example, incident 1234 involved both an Assault and Contraband, this table would list incident 1234 two times, once for Assault and once for Contraband, so it's a one to many relationship between Main Incident Extract and Incident Types. The two tables connect via ID_REPORTABLE_INCIDENT.
- Youth Details - We'll ignore this one for now, but just so you know, it connects to Main Incident Extract via ID_REPORTABLE_INCIDENT. Each incident can involve more then one youth so it's a one to many relationship.
- Caredays Final - We'll also ignore this one for now, but just so you know it connects to Main Incident Extract via ID_FACIL. Each facility has one care day count but many potential incidents so the relationship between Main Incident Extract and Caredays Final is many to one.
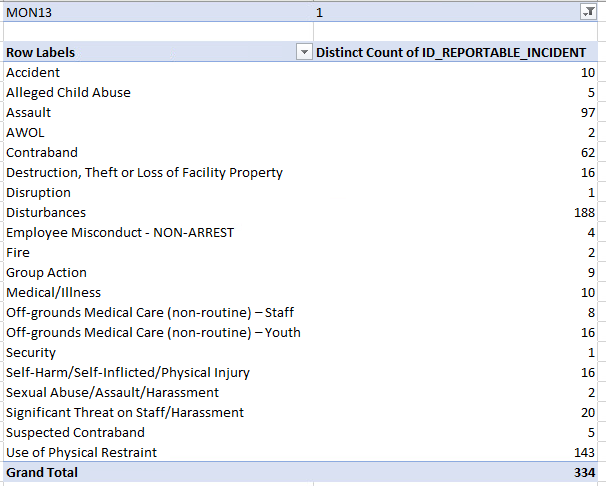
My issue is when I want to slice the incident data by Incident Type. For example, as shown in the second attachment ("Pivot Table 1"), 188 of the 334 incidents that occurred in the most recent month (i.e., MON13) involved a Disturbance.

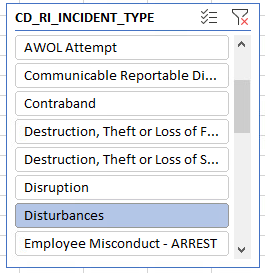
Let's say I want to look at those 188 Disturbance incidents alone. To do that, I added a slicer for CD_RI_INCIDENT_TYPE, which is in the Incident Types table, connected it to all pivot tables in my workbook, and then selected Disturbances (see third attachment, "Slicer").

After selecting Disturbances, I do see that my pivot table listing the incidents by type adjusts to only show the 188 Disturbances...
![]()
... However, when I look at my other pivot tables I am still seeing a total of 334 incidents, not the 188 I expected. For example, Pivot Table 2, which shows the incidents by time of day (a variable/field from Main Incident Extract) still has all 334 incidents, not just the 188 that involved a Disturbance.
![]()
This pivot table only contains variables from Main Incident Extract, but I had assumed, since I connected Main Incident Extract to Incident Types using ID_REPORTABLE_INCIDENT, that slicing on incident type (i.e., CD_RI_INCIDENT_TYPE) should work, even though the variables used in this pivot table come from the Main Incident Extract only.
Is there something I'm missing? How can I get the slicer to work so that pivot tables based on the Main Incident Extract can be sliced by incident type?
Thank you!!! I'm new to using data models so I really appreciate the help.
I couldn't find an article or video for it, though Mynda does show this concept in most of the dashboard videos I have seen; the connection of the pivot tables to the slicers comes from the report connection, not the relationship of the tables. As long as your PTs are using the same pivot cache you simply right-click your slicer>Report Connections which will bring up a list of the PTs you can connect the slicer to and simply choose the PTs you want to control with that slicer. Hope that makes sense and answers your question. Good luck! 🙂
So, are you saying that you have multiple pivot tables that you'd like controlled by a single slicer?
If so, take a look at this page. https://excelchamps.com/pivot-table/link-slicer-to-multiple-pivot-tables/
I already connected all pivot tables to the slicer. The issue is that the slicer for Incident Type seems to be filtering any pivot tables that only include data from the Incident Types table, but not data based on the other tables. For example, if I select Disturbances from the slicer and I look at my pivot table that shows the incident counts by type (which is based on data from the Incident Type table), the pivot table adjusts as expected to only show the 188 incidents that involved a disturbance; however, if I look at my pivot table and chart that show the incident counts by time of day (which is based on data from the Main Extract), I am still seeing all 334 incidents. I would like to see only the 188 incidents that involved a disturbance appear in the time of day pivot table and graph.
Hi Jennifer,
The issue you're having is caused by the direction of the relationships in your model. If you look at the arrows on the connector lines it tells you the filter direction. You can see that the Main Incident table is filtering the Incident types table. Based on your question this is the wrong way around. If you want to filter the main incident table based on a field in the incident types table then the arrow on the connector line needs to be going towards the main incident table.
It's not as simple as changing the direction, because your incident types table is on the many side to the relationship, whereas it most likely should be the other way around. i.e. I'm assuming the Indident types and youth details tables are your dimension tables and your Main Incident and Caredays Final tables are your fact tables. Dimension tables filter fact tables and dimension tables must be on the 'one' side of the many to one relationship, with the fact table on the many side.
It looks like your Main Indident table is also not in the correct tabular layout required for Power Pivot i.e. you have multiple 'Mon' columns. Likewise for your Caredays Final table with multiple 'days' columns. You need to fix this layout with Power Query's Unpivot tool before proceeding further.
There are many problems with this file which tells me you haven't learnt the fundamentals of Power Pivot and now you're running into insurmountable roadblocks. You must be careful building Power Pivot models because sometimes Power Pivot won't return an error telling you something is wrong. It can return values that appear to be correct, so be sure to manually cross check your PivotTable results.
I hope that helps explain things. It's difficult to cover everything here. I recommend you take my Power Pivot & DAX course so you can get to grips with how to set up your data correctly so that you can create the calculations you're after.
Mynda
Thank you for your help. I will play with it some more.
These data get complicated. The Main Incident Extract contains one row for each unique incident that occurred at one of our facilities over the past 13 months. Each incident can involve multiple types (e.g., Contraband, Assault, Accident) so those need to be in a different table connected via a one to many relationship. The same goes for the youth table. Each incident can involve one or more youth, so once again, those records are saved in a different table that connects to the main incident table via a one to many relationship. The care days table is there so I can calculate incident rates per 100 care days. That table contains one record for each facility and the caredays they accrued during each of my thirteen months. The slicers I want to use in the main incident table work fine (counts are as expected) and the slicers in the caredays table work fine. Based on what you're saying, it sounds like I'll have issues with the other two tables (incident type and youth) due to the one to many relationship with my main incident table. I'll see if I can restructure the data somehow.
You should be able to use Power Query to restructure your data.
While the PivotTables you currently have are working fine now, the multiple Mon and Days columns will cause you problems eventually. This PivotTable video tutorial illustrates the issue.
Mynda
