I've previously written about getting real time data (RTD) into Excel using Python.
In this post I'm going to chart that data as it arrives in Excel. Think real-time stock price updates.
The steps required to get this working are:
- Install Python and PyXLL.
- Write a Python function to get the real time data and put it into an Excel sheet.
- Write VBA event code to process that data into a table.
- Write an array formula to fetch the latest 30 data points.
- Create a chart to plot the data from 4.
I've written the Python function for you so you just need to get Python and PyXLL installed and you can be plotting your own real time data.
Download the Workbook and Python Code
Enter your email address below to download the sample workbook containing the code in this post.

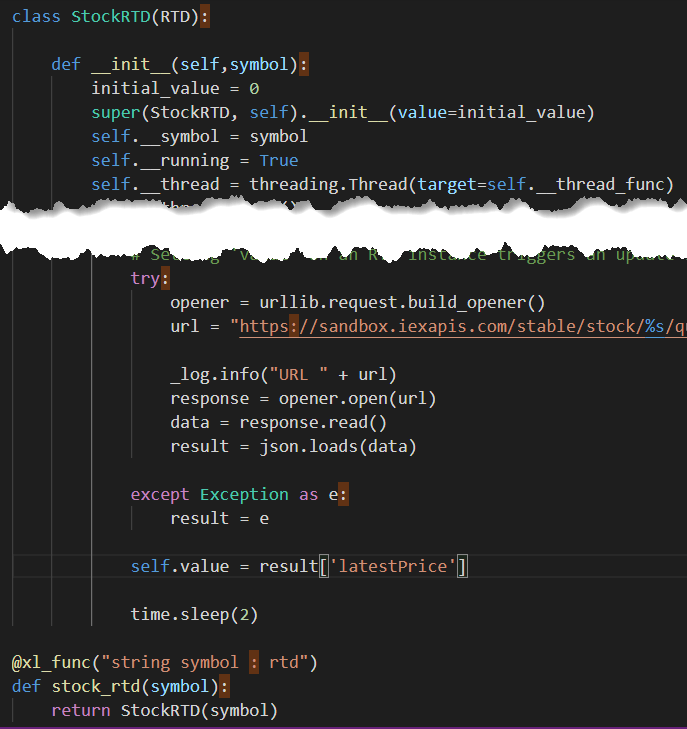
Function to Fetch Real Time Data
I'm using the same function I wrote to get RTD in this blog post.
I've had to make some minor changes like the URL being used to fetch the data.
RTD Data Source
I'm using stock data provided by IEXCloud.io. You can sign up for a free account which allows you to retrieve unlimited test data from their system. They provide a paid service if you want to get real market data.
By sending a HTTPS request to IEXCloud, exactly the same as you do when you click a link to open a page on a website, you get data returned about the company you are interested in.
An example of such a request asking for a quote on Microsoft's stock price is
https://sandbox.iexapis.com/stable/stock/MSFT/quote?token=Tpk_98b4a343d08f419fb1291a195aca0730
The code MSFT specifies that I want information about Microsoft. Change this code to get information on other companies e.g. AAPL for Apple.
If you click that link you'll see something like this
{"symbol": "MSFT", "companyName": "Microsoft Corp.", "primaryExchange": "QSDAAN", "calculationPrice": "close", "open": 185.39, "openTime": 1616306324959, "openSource": "cloififa", "close": 187.2, "closeTime": 1625984148002, "closeSource": "fcilifao", "high": 193.8, "highTime": 1628543496620, "highSource": "etcen 1ery p aeiidl5umd", "low": 188.13, "lowTime": 1637173833781, "lowSource": "yred eld1pnua5e m citei", "latestPrice": 184.4, "latestSource": "Close", "latestTime": "May 7, 2020", "latestUpdate": 1594186049584, "latestVolume": 28838019, "iexRealtimePrice": 190.05, "iexRealtimeSize": 100, "iexLastUpdated": 1621380167409, "delayedPrice": 186.2, "delayedPriceTime": 1659707262460, "oddLotDelayedPrice": 183.6, "oddLotDelayedPriceTime": 1657798168478, "extendedPrice": 187.8, "extendedChange": 0.5, "extendedChangePercent": 0.00285, "extendedPriceTime": 1609328086679, "previousClose": 183.04, "previousVolume": 32634011, "change": 1.06, "changePercent": 0.00587, "volume": 29283999, "iexMarketPercent": 0.01933576245291531, "iexVolume": 559683, "avgTotalVolume": 50424989, "iexBidPrice": 0, "iexBidSize": 0, "iexAskPrice": 0, "iexAskSize": 0, "iexOpen": null, "iexOpenTime": null, "iexClose": 188.18, "iexCloseTime": 1610857954764, "marketCap": 1439473962659, "peRatio": 30.49, "week52High": 196.9, "week52Low": 120.18, "ytdChange": 0.14410775142262264, "lastTradeTime": 1641935074822, "isUSMarketOpen": false}
A bunch of data about Microsoft in JSON format.
The Python code will sift through this, pull out the Latest Price and send it back to Excel.
Using the Python Function to Retrieve RTD
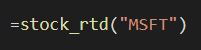
The function is used like any other in Excel.
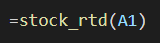
You can pass in the ticker symbol for the company as a string, or reference a cell containing that string.
Every time an update is received, this is written into the calling cell.
Charting the Data
To chart the data you need to keep a record of prices as they come in. I'm going to store prices for each stock in a table on its own sheet.
Using a Worksheet_Calculate() event you can take the new price as it arrives and enter it into a table.
The table looks like this
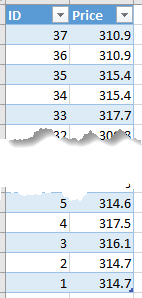
I'm giving each data point a numeric unique ID which can be used to identify it in subsequent processing. If you wanted you could just as easily use a timestamp as the unique identifier, which is provided in the data returned by IEXCloud.
The first price received has ID 1, the second has ID 2 etc. I want to plot the most recent data so I need to get the prices with the largest ID numbers. I'm going to plot 30 points so I need the 30 largest ID's.
Using SORT I can sort the data from the MSFT table into descending order based on ID, and then use INDEX to give me the first 30 in this list i.e. the 30 most recent data points.

In this formula ROW is providing the numbers 1:30 for INDEX to grab the 30 points.
Everything is wrapped in IFERROR because when there is no data in the table, the formula will return #REF errors. Because I'm going to use a scatter plot, #REF will be plotted as 0, but using IFERROR I can replace the #REF with #N/A and #N/A is not plotted.
This isn't a major thing to worry about but does make the chart look a little neater.
Repeat this process on other sheets for other stocks.
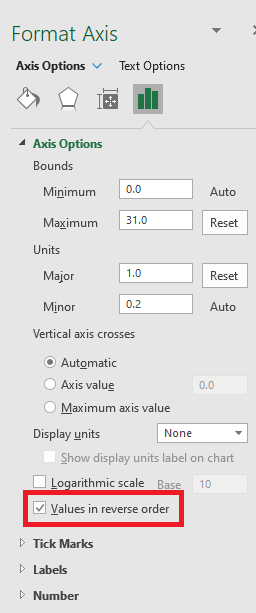
With the 30 points sorted out I just need to create my chart, on another sheet, and configure it to plot this data in reverse order.
Plotting in reverse order means the data flows in from the right side of the chart, rather than the left.
Controlling Data Flow
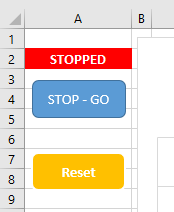
You can start and stop the inflow of data by clicking on the STOP - GO button on the Charts sheet.
Clicking on this toggles data flow and provides a clear visual indication on the Charts sheet and stock price sheets indicating whether or not prices are incoming.
Click Reset to clear the prices from the tables, this will remove all data from the chart.
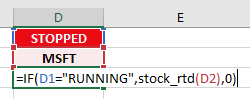
The formula that calls the Python RTD function is actually dependent on this visual indicator. If the system is RUNNING the Python function is called.
If the system is STOPPED, the Python function is not called.
Here's what it looks like in action. Maximise the video clip to get a better view.
Summary
This is intended as a demonstration of what can be done using Python to get real time data.
Download the workbook and Python file (below) and you could modify the code to get other financial information, or some other form of data completely.
I haven't used a timestamp along the x-axis of the chart but you may want to do this. As I said earlier, a timestamp is provided in the data received by the Python function so it's a case of passing that through to Excel for processing.


Hello,
Firstly I would like to thank you for your tips and videos. It has helped me a lot.
I am trying to create a dashboard that retrieves live data from a highlight report. I have multiple users who will be updating the highlight report on a monthly basis and I require the data to feed into the dashboard. Is this something you can advise? Many Thanks
Hi Momota,
Your description doesn’t sound like ‘real time’ is being used as the highlight report is only updated once a month.
In such a case I’d probably just use Power Query to get the updated data and that would then feed into your dashboard. Getting the new data is as easy as clicking a button.
Click this link to find out more about ->>> Power Query
Regards
Phil
py code not runs
Hi,
There could be many reasons for that. Please start a topic on our forum and provide full details of the issue, and attach the files you are using.
Regards
Phil
sir,
i created a vba code for copy and paste data for every 5min,15min,30min and 60 min in different coumns and keep refreshing new data based on time,the source of data from a charting software with RTD function and paste special XML type.when i run Macro for this operation,Live data freezing and not updating ,which was getting source from external software.while Macro not activated Live data feeding to workbook is perfect.only problem comes as soon as my macro starts running .
i needed in such a way that,while macro running should not interrupt in feeding live data into specified columns.
kindly guide changes to fulfill my requirement.
my code follows and pasted all VBA codes for full operation
————————–
Sub MyData()
Application.Wait Now + TimeValue(“00:00:05”)
MsgBox “P&OI data Start Updating”
Sheets(“LATEST”).Range(“A2:A150”).Copy
Sheets(“P_OI”).Range(“A3:A153”).PasteSpecial Paste:=xlPasteValues
Sheets(“LATEST”).Range(“E2:F150”).Copy
Sheets(“P_OI”).Range(“H3:I153”).PasteSpecial Paste:=xlPasteValues
Sheets(“LATEST”).Range(“E2:F150”).Copy
Sheets(“P_OI”).Range(“B3:C153”).PasteSpecial Paste:=xlPasteValues
Sheets(“LATEST”).Range(“E2:F150”).Copy
Sheets(“P_OI”).Range(“D3:E153”).PasteSpecial Paste:=xlPasteValues
Sheets(“LATEST”).Range(“E2:F150”).Copy
Sheets(“P_OI”).Range(“F3:G153”).PasteSpecial Paste:=xlPasteValues
Sheets(“LATEST”).Range(“E2:F150”).Copy
Sheets(“P_OI”).Range(“N3:O153”).PasteSpecial Paste:=xlPasteValues
Call Min5
Application.Wait Now + TimeValue(“00:00:02”)
Sheets(“LATEST”).Range(“E2:F150”).Copy
Sheets(“P_OI”).Range(“B3:C153”).PasteSpecial Paste:=xlPasteValues
Call Min5
Application.Wait Now + TimeValue(“00:00:02”)
Sheets(“LATEST”).Range(“E2:F150”).Copy
Sheets(“P_OI”).Range(“B3:C153”).PasteSpecial Paste:=xlPasteValues
Sheets(“LATEST”).Range(“E2:F150”).Copy
Sheets(“P_OI”).Range(“D3:E153”).PasteSpecial Paste:=xlPasteValues
Call Min5
Application.Wait Now + TimeValue(“00:00:02”)
Sheets(“LATEST”).Range(“E2:F150”).Copy
Sheets(“P_OI”).Range(“B3:C153”).PasteSpecial Paste:=xlPasteValues
Call Min5
Application.Wait Now + TimeValue(“00:00:02”)
Sheets(“LATEST”).Range(“E2:F150”).Copy
Sheets(“P_OI”).Range(“B3:C153”).PasteSpecial Paste:=xlPasteValues
Sheets(“LATEST”).Range(“E2:F150”).Copy
Sheets(“P_OI”).Range(“D3:E153”).PasteSpecial Paste:=xlPasteValues
Sheets(“LATEST”).Range(“E2:F150”).Copy
Sheets(“P_OI”).Range(“F3:G153”).PasteSpecial Paste:=xlPasteValues
end sub
————————–
Sub Min5()
Call Wait5min
Application.Wait Now + TimeValue(“00:00:03”)
Sheets(“LATEST”).Range(“E2:F150”).Copy
Sheets(“P_OI”).Range(“H3:I153”).PasteSpecial Paste:=xlPasteValues
Call Wait5min
Application.Wait Now + TimeValue(“00:00:03”)
Sheets(“LATEST”).Range(“E2:F150”).Copy
Sheets(“P_OI”).Range(“H3:I153”).PasteSpecial Paste:=xlPasteValues
Call pause
End Sub
—————————————————–
Sub Wait5min()
Dim i As Long
For i = 1 To 144000
Application.StatusBar = i
DoEvents
‘If i Mod 1000 = 0 Then
‘ DoEvents
‘End If
Next i
End Sub
————————————-
Sub pause()
Dim i As Long
For i = 1 To 432000
Application.StatusBar = i
DoEvents
‘If i Mod 1000 = 0 Then
‘ DoEvents
‘End If
Next i
End Sub
——————————————————-
Your ranges seem to be always the same, why are you copying data, instead of using formulas to bring latest data in Sheets(“P_OI”)? If you don’t want to display live changes but only at those specific times, just turn calculation to manual, and your macro should just run a code like Application.CalculateFull to update formulas.