
How many times have you manually updated a chart, recoloured a bar, searched for a file, or scanned a task list to see what is overdue?
Most Excel users manually repeat tasks every week that Excel can handle automatically.
In this guide, you will learn 8 simple Excel automations that eliminate repetitive work, reduce errors, and make your spreadsheets update themselves.
Table of Contents
- Watch the Video
- Download Workbook
- 1. Make Your Data Auto-Expand Using Excel Tables
- 2. Automatically Highlight the Highest and Lowest Values in a Chart
- 3. Let Excel Write Formulas for You with Copilot
- 4. Open Files Instantly from Excel Using the HYPERLINK Function
- 5. Make Tasks Highlight Themselves with Conditional Formatting
- 6. Use Python Inside Excel for Instant Statistical Analysis
- 7. Send Personalised WhatsApp Messages from Excel
- 8. Use Copilot Agent to Clean Data Automatically
- Why Excel Automation Matters
Watch the Excel Automation Video

Get the Practice Workbook
Enter your email address below to download the free file.

1. Make Your Data Auto-Expand Using Excel Tables
The Problem
Charts, formulas, and PivotTables stop updating when new data is added because they are built on fixed ranges.
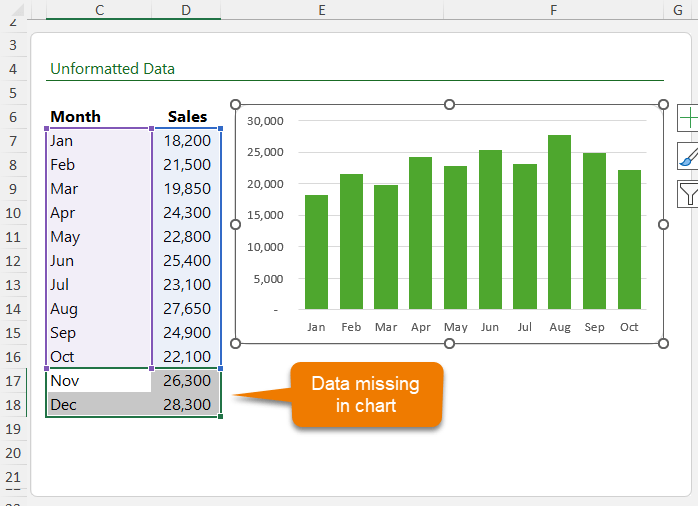
The Solution
Convert your data range into an Excel Table.
How to Do It
- Select your data.
- Press Ctrl + T.
- Confirm that your table has headers.
Now when you add new rows, your:
- Charts update automatically
- Formulas expand automatically
- PivotTables include new data
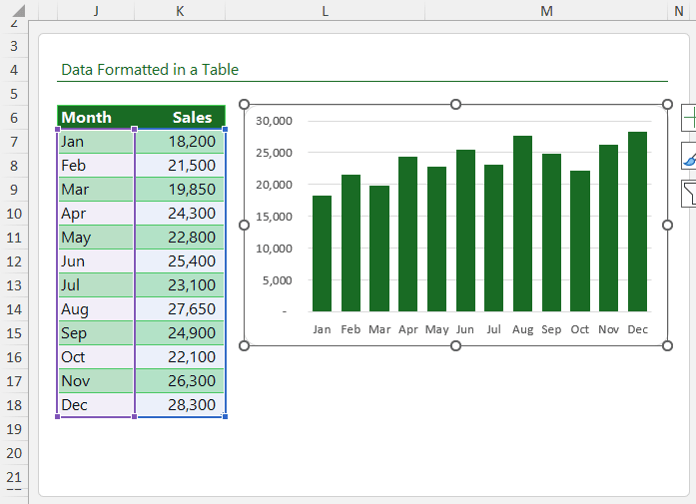
Why this matters for automation: Excel Tables create dynamic data structures. Anything built on top of them becomes self-updating.
Best practice: Always build dashboards and reports on Excel Tables, not static ranges.
2. Automatically Highlight the Highest and Lowest Values in a Chart
The Problem
Users manually recolour the highest bar in a chart.
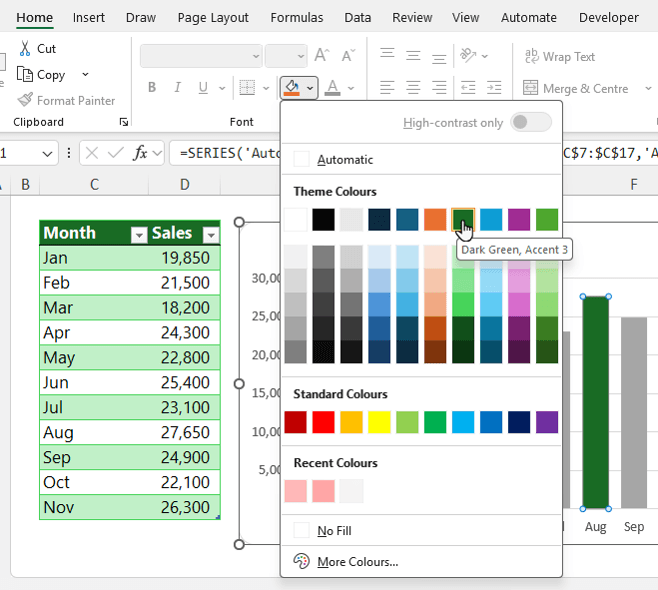
When the data changes, the highlight is wrong.
The Solution
Use helper columns with formulas to dynamically identify high and low values.
Step 1: Add a High Column
=IF([@Sales]=MAX([Sales]),[@Sales],"")
This formula returns the sales value only if it equals the maximum. Otherwise, it returns blank.
Step 2: Add a Low Column
=IF([@Sales]=MIN([Sales]),[@Sales],"")
This returns the minimum value dynamically.
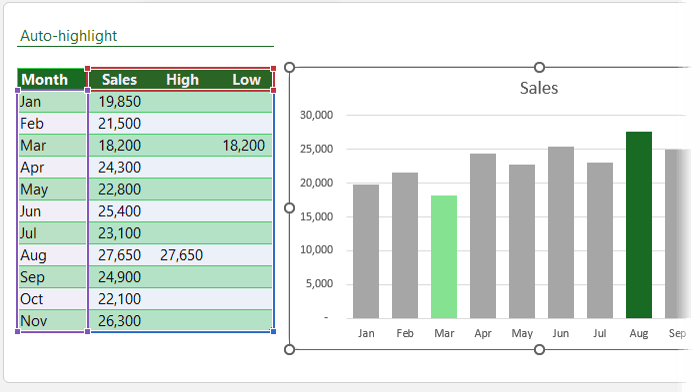
Step 3: Add These as Chart Series
- Add both columns as new chart series
- Set series overlap to 100%
- Format each series with a distinct colour
Now Excel automatically highlights the highest and lowest values in the chart whenever data changes.
3. Let Excel Write Formulas for You with Copilot
If you are using Microsoft 365 with Copilot, Excel can suggest or generate formulas automatically.
How It Works
- Start typing a formula.
- Excel analyses surrounding data.
- It suggests a formula using AI prediction.
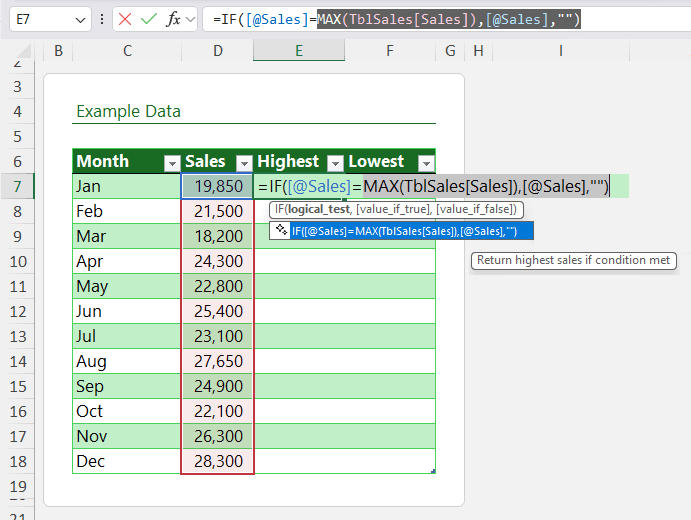
With the first formula entered, Copilot is even quicker to write the formula for Lowest:
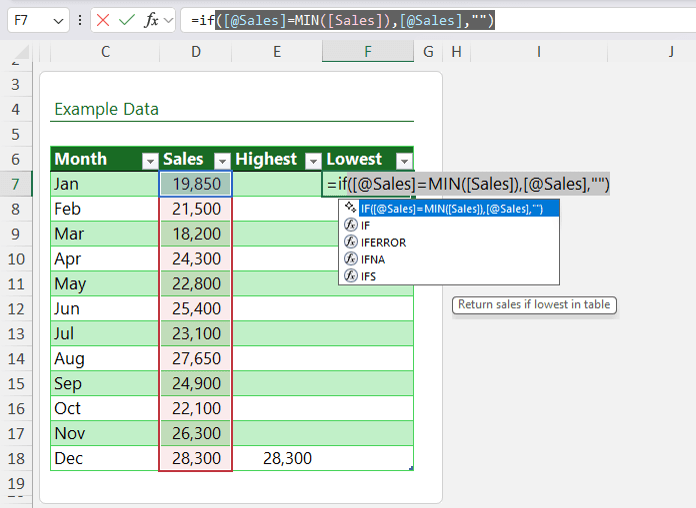
Copilot performs well with:
- Totals
- Counts
- Averages
- Basic conditional logic
Important: It does not replace understanding formulas. It accelerates writing them.
4. Open Files Instantly from Excel Using the HYPERLINK Function
The Problem
You repeatedly navigate to folders to open documents related to the Excel file you’re working on.
The Solution
Use the HYPERLINK function to generate clickable file links.
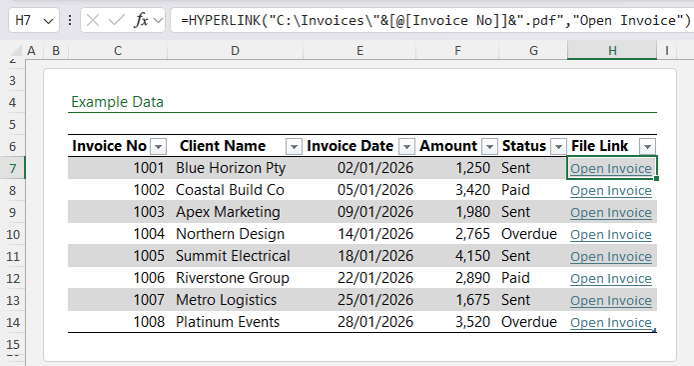
Example Formula
=HYPERLINK("C:\Invoices\"&[@[Invoice No]]&".pdf","Open Invoice")
How it works:
- The file path is enclosed in quotes
- The invoice number is dynamically inserted with the ampersand and reference to the invoice number column in the table
- The last argument for the friendly name is what displays in the cell
Tip: If your data is in an Excel Table, the formula copies down automatically.
Use cases:
- Open invoices
- Link to folders
- Jump between worksheets
- Create dynamic navigation menus
Now you can easily use Excel hyperlinks to open files automatically.
5. Make Tasks Highlight Themselves with Conditional Formatting
The Problem
You manually scan for overdue tasks.
The Solution
Use Conditional Formatting with the TODAY function to highlight tasks that need your attention.
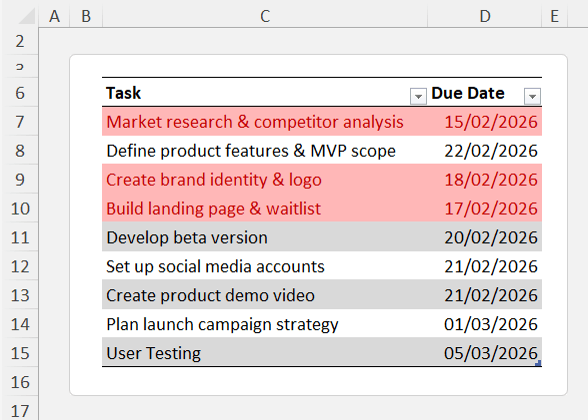
Basic Overdue Rule
- Select your task range.
- Go to Home > Conditional Formatting > New Rule.
- Choose “Use a formula to determine which cells to format”.
- Enter:
=$D7<=TODAY()
Note: be sure to remove the dollar sign before the row number so each row is evaluated individually.
Format with red font and light red fill.
Now Excel highlights overdue tasks automatically.
Add a 3-Day Warning Window
Edit the formula to:
=$D7<=TODAY()+3
This includes tasks due within the next three days.
The TODAY function updates automatically every time you open the workbook.
6. Use Python Inside Excel for Instant Statistical Analysis
Microsoft 365 now includes Python directly inside Excel for eligible licenses.
This allows you to perform advanced analysis without complex formulas.
Step 1: Enter Python Mode
Type:
=PY
Press Tab to put Excel into Python mode:
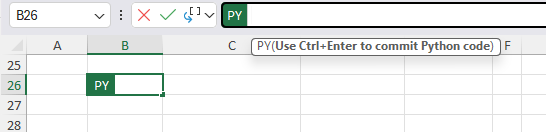
Step 2: Create a DataFrame
Select the cells in the table you want to analyse and Excel will enter the Python reference:
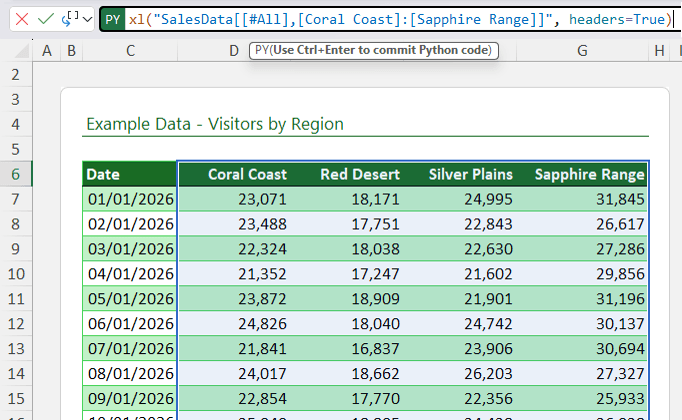
xl("SalesData[[#All],[Coral Coast]:[Sapphire Range]]", headers=True)
Press Ctrl + Enter.
Step 3: Generate Summary Statistics
Type =PY → tab, then click in the cell containing the dataframe:
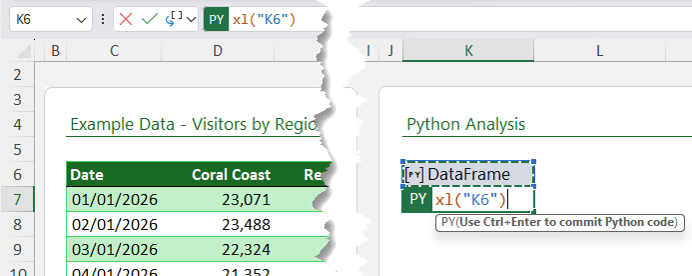
Then type
.describe()You should see this in the formula:
xl("K6").describe()
Press Ctrl+Enter to complete the Python formula.
Switch the output display to “Excel value” to view:
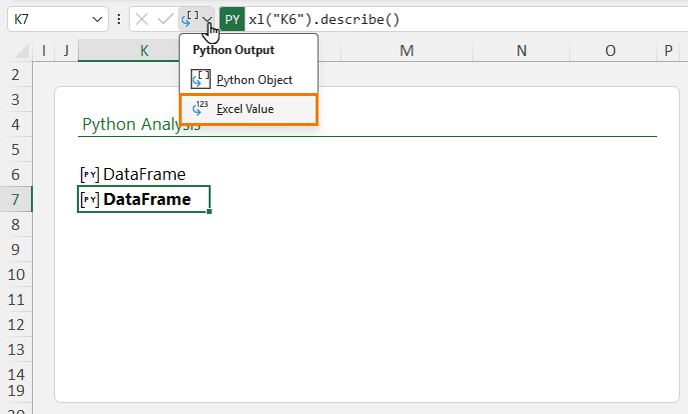
Now you should see the
- Count
- Mean
- Standard deviation
- Minimum
- Maximum
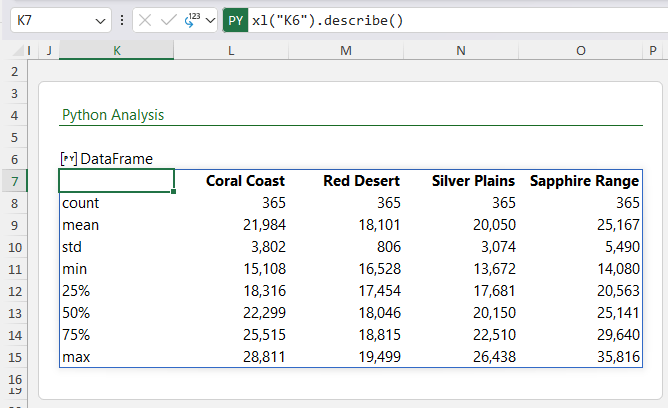
Example: Get Totals
Want totals for each region? Use the sum() function to automatically return them. For a horizontal output, follow it with to_frame() to transpose them.
xl("K6").sum().to_frame().T
Python reduces multi-step analysis to a single expression.
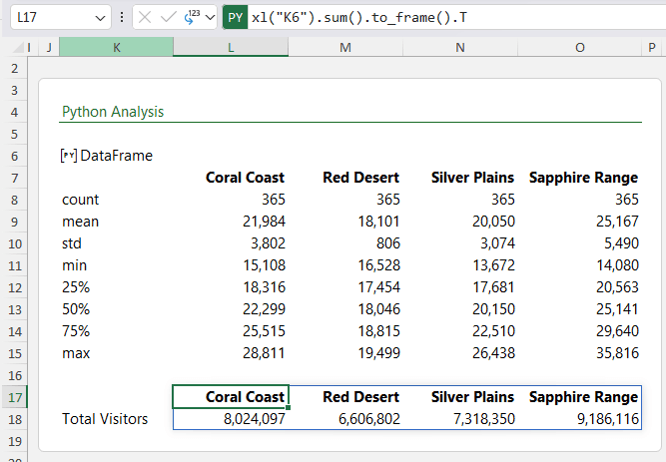
Now Python statistics in Excel are super quick and easy.
7. Send Personalised WhatsApp Messages from Excel
The Concept
Use Excel to generate WhatsApp message links using the official wa.me API.
Important: Phone numbers must include country code and no spaces.
Download the WhatsApp desktop app. Then use a formula to automatically generate the messages.
Example Formula
=HYPERLINK("https://wa.me/"&D5&
"?text=Hello "&C5&
", your balance of "&TEXT(E5,"$#,##0.00")&
" is due on "&TEXT(F5,"D-MMM-YY")&
". Please contact us to arrange payment.")
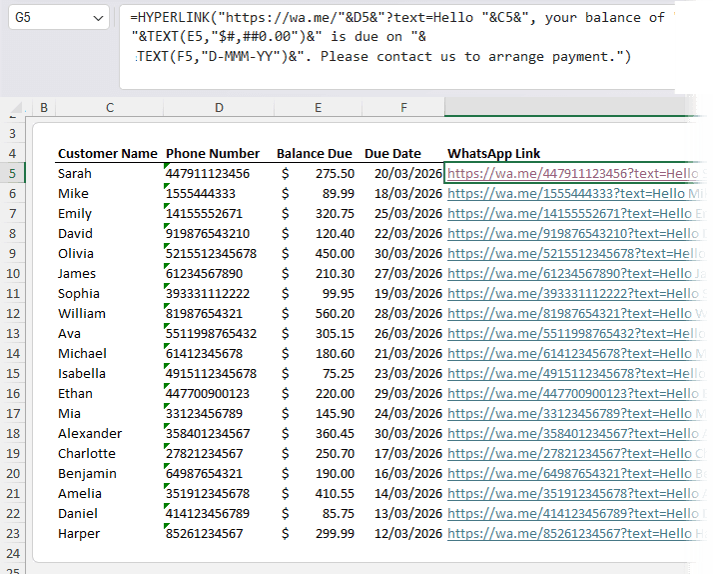
What this does:
- Inserts the phone number
- Personalises with the customer name
- Formats currency
- Formats date
- Generates a clickable message link
When clicked, it opens WhatsApp Desktop with the message pre-filled.
Use cases:
- Payment reminders
- Appointment confirmations
- Event notifications
- Promotional campaigns
Now you’re all set to send WhatsApp messages from Excel.
8. Use Copilot Agent to Clean Data Automatically
Data cleaning often takes longer than analysis.
Copilot Agent can:
- Rename inconsistent headers
- Remove extra spaces
- Standardise date formats
- Correct capitalization
- Flag anomalies
How to Use It
Let’s look at using Copilot Agent to clean this messy data:
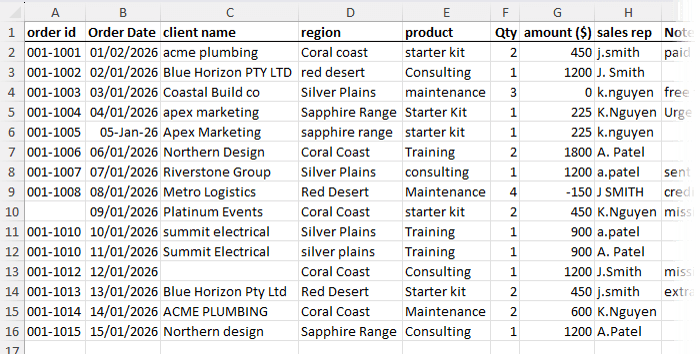
- Click anywhere in your dataset.
- Go to Home > Copilot.
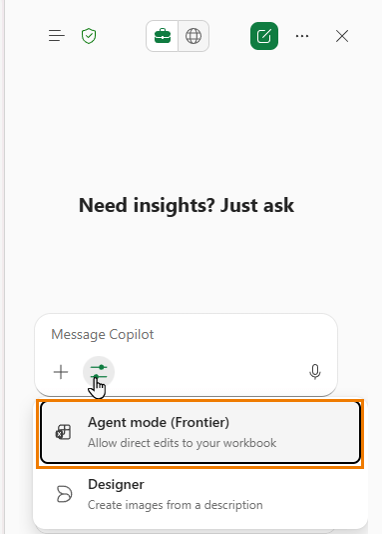
- Switch to Agent mode:
- Enter the prompt:
“Review the data in this worksheet and clean it ready for analysis. Also advise of any issues or anomalies I should look into further.”
Copilot:
- Applies cleaning steps
- Displays changes made
- Flags issues requiring review
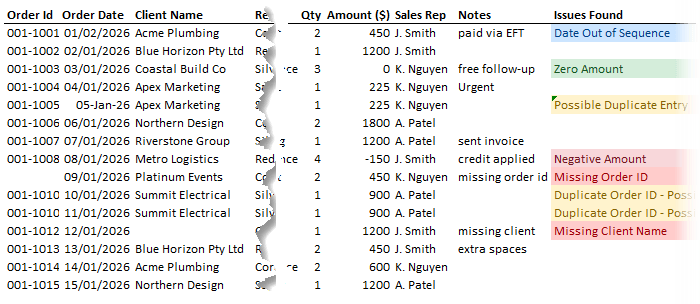
Now you’re all set to use Excel Copilot Agent to clean data automatically. Note: It does not replace judgment, but it significantly reduces manual preparation time.
Why Excel Automation Matters
Automation in Excel is not about complexity.
It is about eliminating repetitive tasks. The more your spreadsheet updates itself, the less time you spend maintaining it.
Automation reduces:
- Human error
- Rework
- Manual correction cycles
It increases:
- Accuracy
- Efficiency
- Professional polish