
There are certain Excel tasks that come up in almost every job. Controlling what people can type, keeping data organised, and building spreadsheets that update automatically when new data is added are examples most professionals encounter regularly.
Unfortunately, these are rarely taught properly. Many people rely on searching for solutions each time they run into a problem, repeating manual work, or avoiding tasks that feel too complicated.
This guide walks you through practical Excel tricks that save time, reduce errors, and make spreadsheets easier to maintain. These are real workplace skills that improve reporting, analysis, and collaboration.
Table of Contents
- Watch the Essential Excel Tricks Video
- Download Workbook
- Trick 1: Convert Data into Excel Tables
- Trick 2: Use Slicers to Create Interactive Filters
- Trick 3: Use Focus Cell to Improve Navigation
- Trick 4: Use Flash Fill to Transform Text Automatically
- Trick 5: Fill Empty Cells Quickly
- Trick 6: Use Data Validation to Control User Input
- Trick 7: Create Dynamic Print Ranges for Reports and PDFs
- Why These Excel Tricks Matter in Real Jobs
- Next Step: Learn the Excel Functions That Power Analysis
Watch the Step-by-step Video

Download the Practice File
Enter your email address below to download the free file.

Trick 1: Convert Data into Excel Tables
If you only apply one improvement to your spreadsheets, make it converting data into an Excel Table.
Many users store data in regular cell ranges like this:
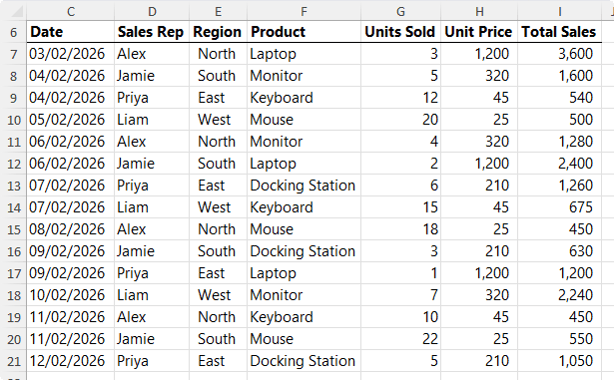
While this looks organised, it creates several problems:
- Formulas often fail to copy when new rows are added.
- Charts and PivotTables do not update automatically.
- Maintaining the file becomes tedious and error prone.
Why Excel Tables Are Better
Excel Tables automatically expand when new data is added. This means formulas, formatting, and connected reports update without manual adjustments.
Tables also introduce structured references. Instead of formulas referencing cell ranges, they reference column names so this:
=SUM(I7:I21)
Becomes:
=SUM(Table1[Total Sales])
This makes formulas easier to understand and maintain long term.
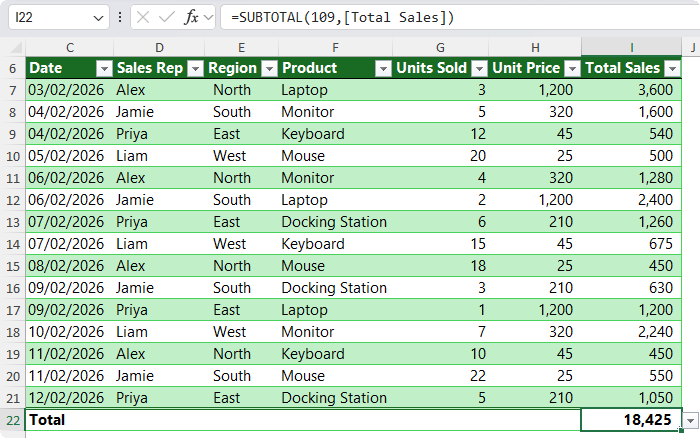
Tables also include built in filtering, quick formatting options, and automatic totals like this:
How to Convert Data to a Table
- Select any cell within your dataset
- Press Ctrl + T on Windows or Cmd + T on Mac
- Confirm that your data contains headers
- Click OK
Once your data is converted, add a new row and watch Excel automatically extend formulas and formatting.
Excel Tables form the foundation for dashboards, PivotTables, charts, and Power Pivot data models.
Trick 2: Use Slicers to Create Interactive Filters
Once your data is stored in a Table, you can make it easier to explore by adding Slicers:
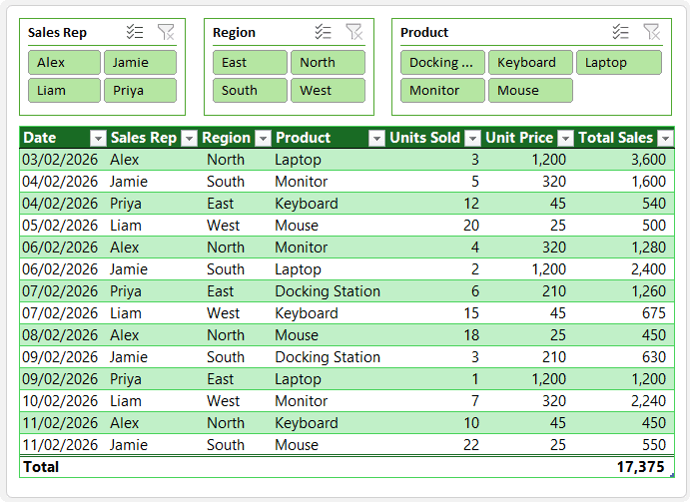
Slicers are visual filtering tools that allow users to filter data with clickable buttons instead of dropdown menus.
They are especially useful when sharing spreadsheets with colleagues or presenting reports to managers who want quick and clear filtering.
How to Insert Slicers
- Click anywhere inside your Table
- Go to the Table Design tab
- Select Insert Slicer
- Choose the fields you want users to filter by
- Resize and position the slicers on your sheet via the Slicer tab on the ribbon
Slicers allow users to select single or multiple filter options and quickly reset filters when needed.
They are commonly used in dashboards, sales reports, project trackers, and inventory reports.
Turning Excel Data into Dashboards and Reports
Once your data is structured as a Table and enhanced with slicers, many users begin thinking about dashboards and advanced reporting.
Learning how to build dashboards is not just about charts. It involves cleaning data, structuring datasets correctly, and choosing the right reporting tools. Sometimes Excel is the best choice, while other situations require Power BI.
If you want to learn how to build professional dashboards and reports from raw data, you can explore my Excel Data Analyst Fast Track course. It covers data preparation, dashboard creation, and Power BI reporting workflows used in real business environments.
Trick 3: Use Focus Cell to Improve Navigation
Large spreadsheets can be difficult to read. When working across many rows and columns, it is easy to lose track of which data relates to which record.
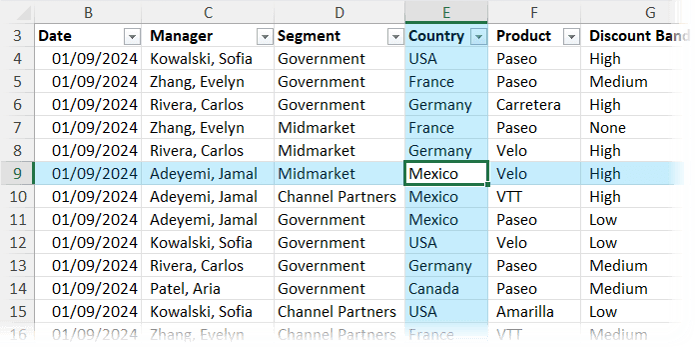
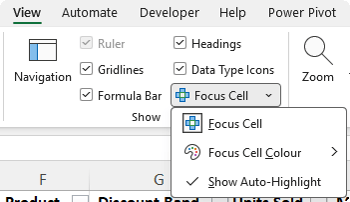
Focus Cell highlights the entire row and column of the active cell, making navigation much easier. You can see it in action in the screenshot below:
How to Enable Focus Cell
- Go to the View tab
- Enable Focus Cell
- Optional: Change highlight colour in Excel settings
This feature improves accuracy and reduces eye strain when working with large datasets.
Trick 4: Use Flash Fill to Transform Text Automatically
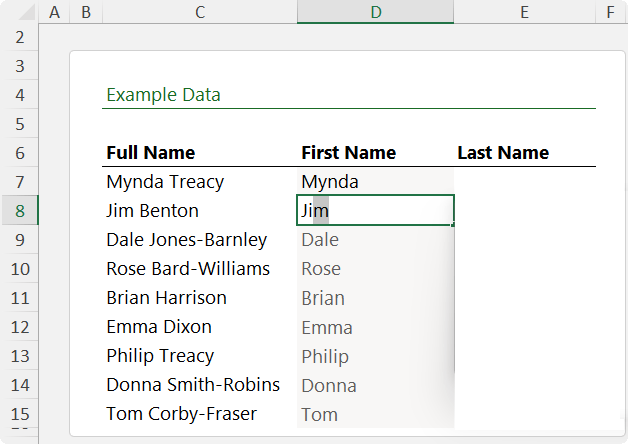
Flash Fill recognises patterns and fills data automatically. It is extremely useful for splitting names, extracting text, or reformatting values.
Instead of writing formulas or manually editing data, Flash Fill learns from examples and completes the list for you:
How to Use Flash Fill
- Type a couple of examples of the desired output
- Excel should detect the pattern and then you can press Enter. If not, press Ctrl + E to trigger Flash Fill.
- Excel applies the pattern to remaining rows
If Excel makes a mistake, provide another example to improve accuracy.
Flash Fill works best when data follows consistent formatting.
Trick 5: Fill Empty Cells Quickly
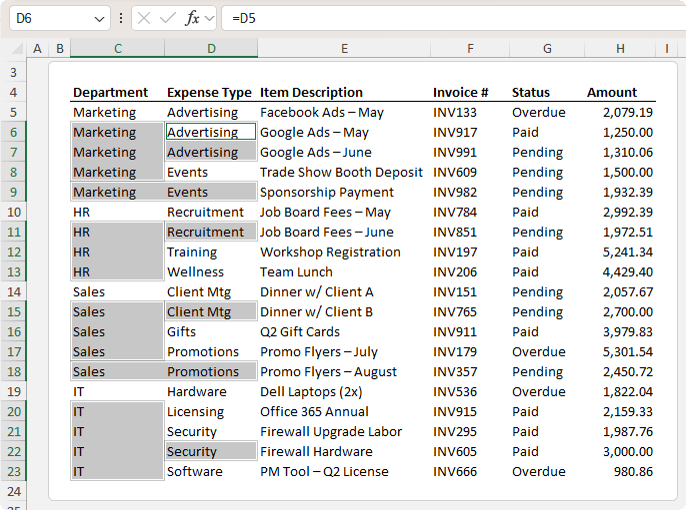
Blank cells like those highlighted below can cause problems when building formulas or PivotTables.
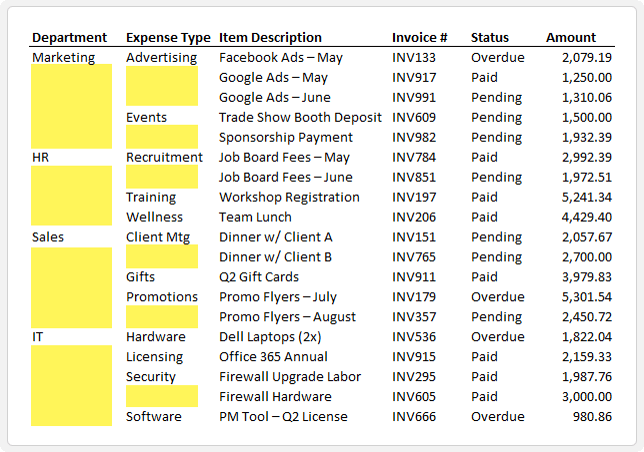
Filling these cells manually is time consuming, but Excel provides a faster method.
How to Fill Blank Cells Efficiently
- Select the column or dataset
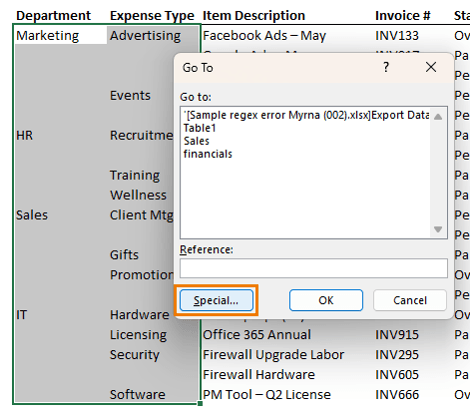
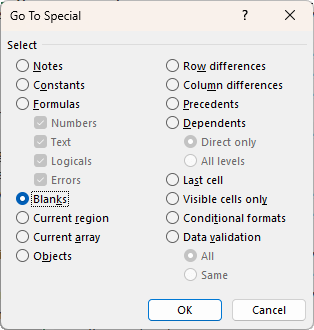
- Press Ctrl + G and choose Special:
- Select Blanks:
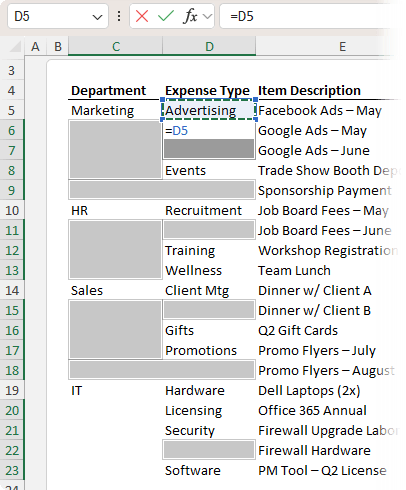
- Type equals and press the up arrow:
- Press Ctrl + Enter to fill all selected blanks:
- Copy and paste values to remove formulas
This technique prepares data for analysis and reporting.
Trick 6: Use Data Validation to Control User Input
Allowing users to enter unrestricted data leads to inconsistent values, broken formulas, and inaccurate reports.
Data Validation ensures users can only enter approved values or valid data types.
Creating Drop Down Lists
- Select input cells
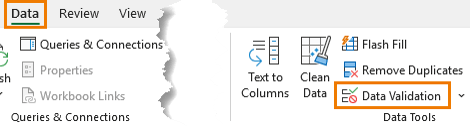
- Go to Data tab and choose Data Validation:
- Select List under Allow
- In the Source field, enter values manually or reference a range:
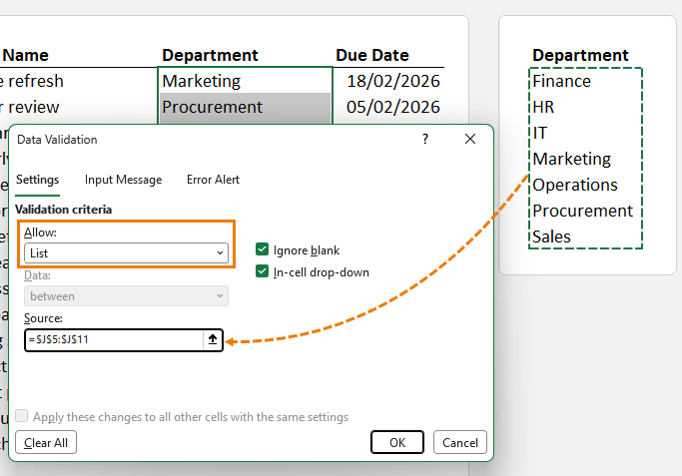
Drop down lists enforce consistent categories such as departments, project status, or product types.
Validating Dates and Numeric Entries
Data Validation can also restrict dates, numbers, or text length.
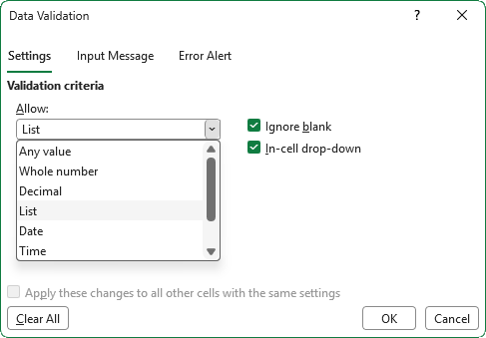
You can include input instructions and custom error messages to guide users:
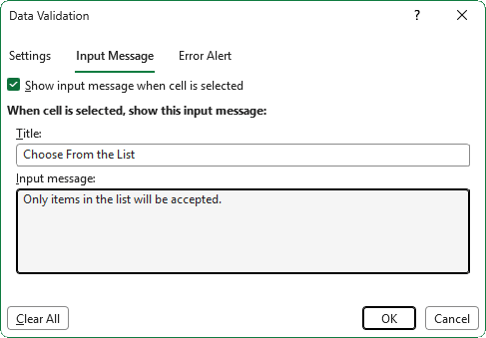
This dramatically improves data quality and reduces cleanup work later.
Trick 7: Create Dynamic Print Ranges for Reports and PDFs
Printing Excel reports whether on paper or to PDF can be frustrating when report size changes regularly. Fixed print areas often include blank rows or cut off data.
Dynamic print ranges solve this by automatically adjusting the print area based on available data.
How Dynamic Print Ranges Work
You create a dynamic named range that uses formulas such as OFFSET or INDEX to adjust the printable area dynamically.
This technique is ideal for invoices, monthly reports, and automated templates where the range changes frequently.
Example Concept – See the Video above for Step by Step Instructions
- Define a named range using OFFSET
- Count rows in a data table to adjust report height
- Assign the named range to the worksheet Print Area
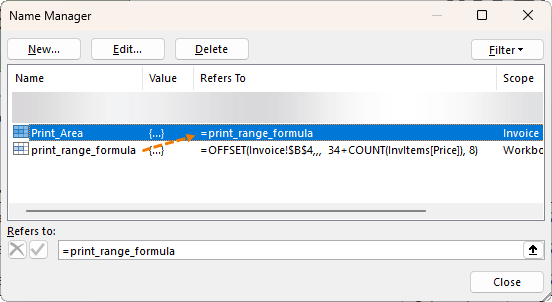
When new rows are added, the print range and preview updates automatically.
Dynamic print ranges are powerful automation tools for professional reporting workflows.
Why These Excel Tricks Matter in Real Jobs
These techniques improve productivity, accuracy, and confidence when working with data.
They help users:
- Prevent errors
- Reduce repetitive manual work
- Create professional reports
- Build scalable spreadsheets
- Prepare data for dashboards and analytics
This enables you to use modern Excel as a reporting and analysis platform across finance, operations, marketing, and project management roles to name a few.
Next Step: Learn the Excel Functions That Power Analysis
These structural Excel skills make spreadsheets easier to manage. However, advanced productivity also depends on knowing the right formulas and functions.
If you want to expand your analytical skills, the next step is learning Advanced Excel formulas that professionals use daily for calculations, data transformation, and reporting.