In this tutorial we're going to reformat Excel reports with Power Query.
Why? Because external systems can create some pretty ugly reports. Here’s one from a popular Australian accounting system, MYOB:
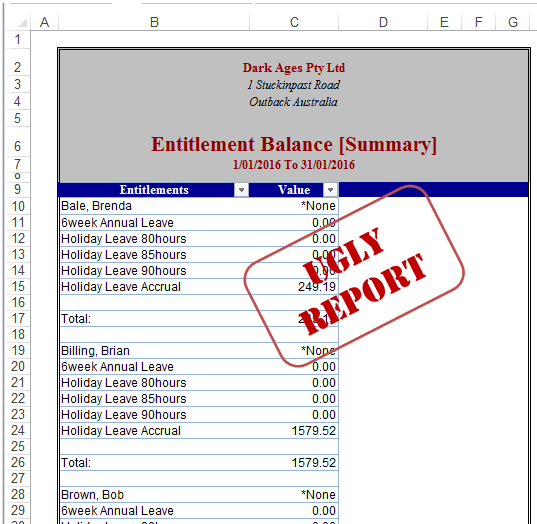
It’s not just ugly because of how it looks. It’s also ugly because the layout prevents you from (easily) doing any further analysis of the data.
According to Excel legend the most common button in external reporting systems is ‘Export to Excel’.
Unfortunately 99% of these external systems spew out useless formatted reports like the one above, when what we really need is the data in a Tabular format.
What’s an Excel Geek to do?
You could spend some time cutting/pasting/transposing etc. to reformat the report into a Tabular format, but doing this every month gets pretty tedious.
You could write some VBA to automatically reformat the report for you. But then you have to know how to write VBA to do that.
My preference is to use Power Query to transform the report into this super useful Tabular layout like this:
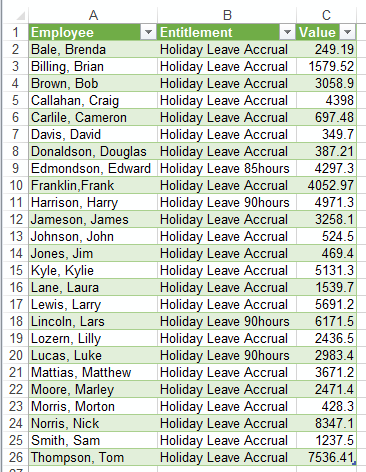
Once it’s in a Tabular format you can easily use Excel’s tools to analyse the data. Tools like PivotTables, SUMIF(S), COUNTIF(S) and other aggregate functions to summarise the data.
Not sure if you have Power Query in your version of Excel? Here is a list of which versions of Excel include Power Query.
Download the Workbook
Enter your email address below to download the sample workbook.
Watch the Video
Reformat Excel Reports with Power Query
There are several steps to transform the ugly duckling MYOB report into a super useful Excel swan, but they’re easy (unlike VBA). It took me 1 minute 30 seconds to complete the following steps.
And even better, once you create those steps you can use it again next month with the click of the Refresh button.
- Select the data you want to work with, in my case it’s in cells B9:C221. Go to the Power Query tab (or Data Tab for Excel 2016), From Table:
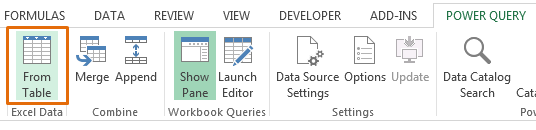
Note: if your data isn’t formatted in an Excel Table then it will do this for you and ask you if it has headers before loading it into Power Query.
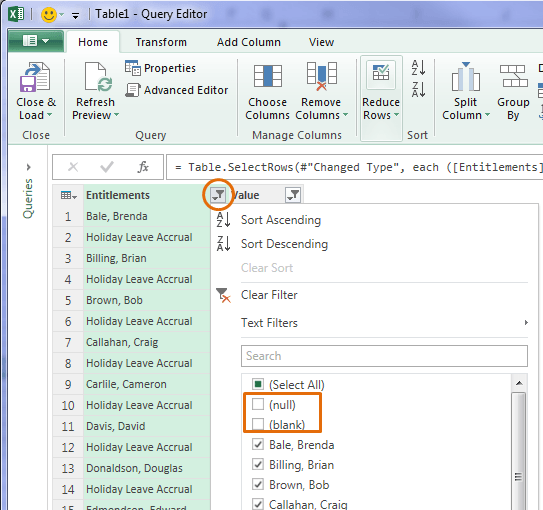
- We need to start culling parts of the report that we don’t need. I’ll use the column filters (they work just like in Excel), to remove the empty and ‘Total:’ rows from the Entitlements column and from the Value column I’ll remove all of the zero values:
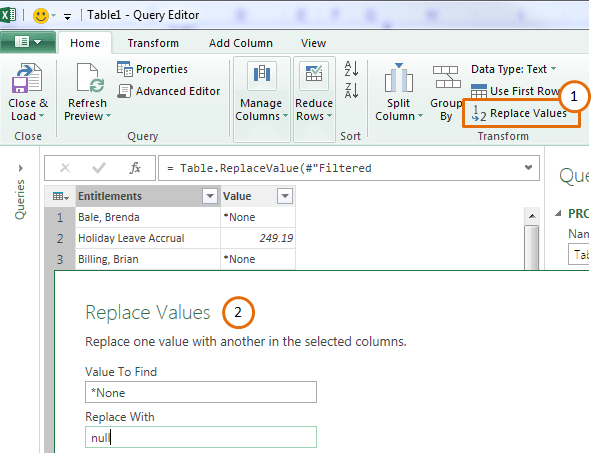
- I need to replace *None in the Value column with null. Null in Power Query is the equivalent to an empty cell. To do this select the Value column > Home tab > Transform group: Replace Values:
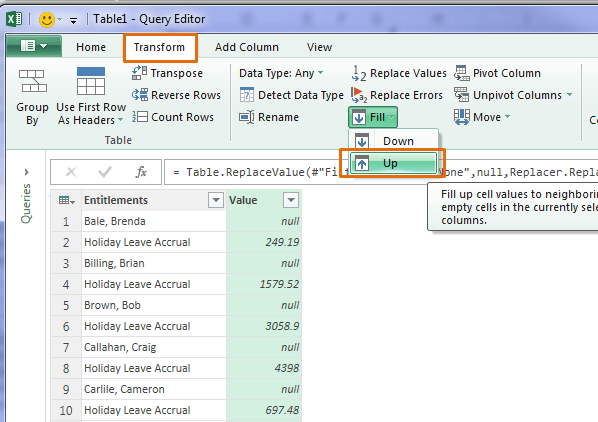
- Now I can replace the ‘null’ cells with the entitlement amounts. Select the Value column and on the Transform tab > Fill > Up:
- We need to split the Entitlements column into one for the name and one for the entitlements. We use some Power Query magic dust to do this.
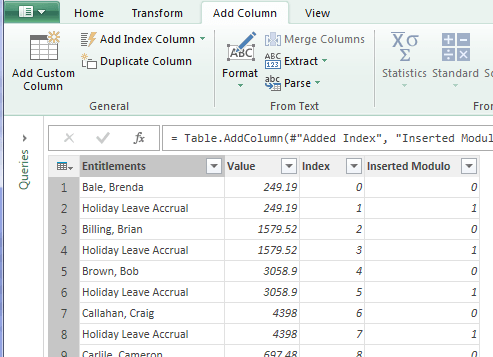
On the Add Column tab > Add Index Column (starting at zero is fine).
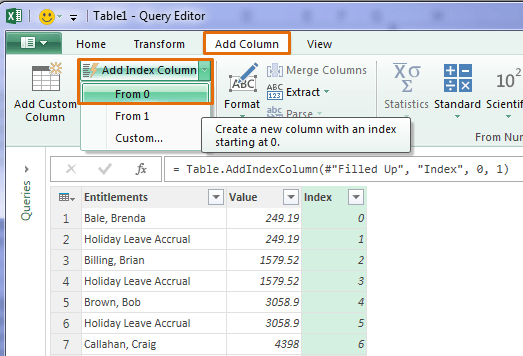
You’ll end up with a new column called Index which simply numbers each row starting at zero:
- Now we need to use the Index column to add a Modulo column. With the Index column selected > Add Column tab > Standard > Modulo:
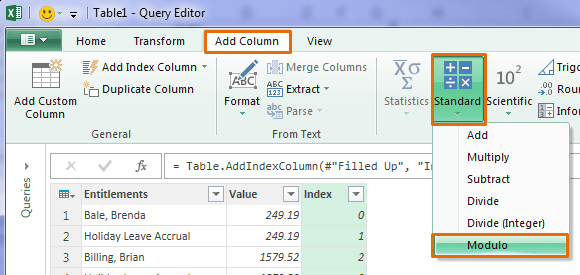
At the Modulo dialog box enter 2, which is the Index number for the second record (name) in the Entitlements column.
It should look like the image below, with a zero for the rows containing names and a 1 for the type of entitlement:
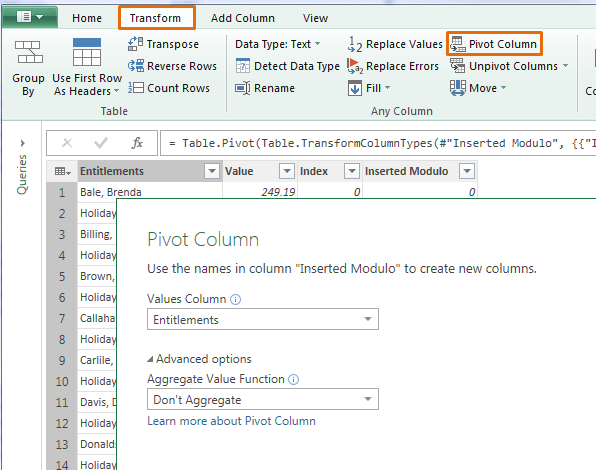
- Now we can use the Modulo column to pivot the data and split the Name and Entitlement into two columns.
Select the ‘Inserted Modulo’ column > Transform tab > Pivot. In the Pivot Column dialog box choose Entitlements as the values column and under ‘Advanced Options’ choose ‘Don’t Aggregate’:
Now we have the names and entitlement types split into two separate columns (named 0 and 1):
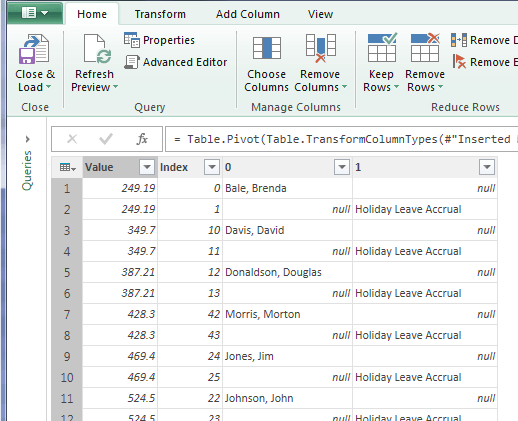
- All we need to do now is use the Fill Up tool we used earlier to replace the null values in column 1 (Entitlements).
- Next filter out the rows containing null from column 0 (Names).
- Delete the Index column (select and press the DELETE key). Its work is done.
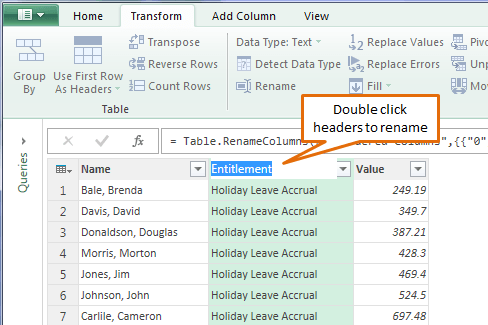
- Drag and drop the columns to rearrange their order so Value is the third column.
- Rename columns 0 and 1: double click the column headers and type in new names:
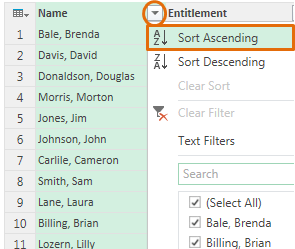
- For bonus points let’s sort by the Name column. Select the Name column > click on the Filter button > Sort Ascending:
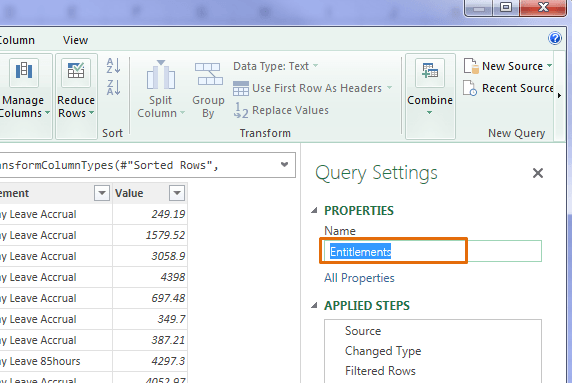
- Before we load the data into Excel let’s give the query a better name. In the Query Settings: Properties type a new name in the Name field:
Now you’re ready to Close and Load your data into a new, nicely formatted Excel Table:
Don't be put off by the number of steps involved. Remember it only took me 1 minute and 30 seconds to complete the steps above and next month you can reuse the query, so it'll take you a few seconds to press the Refresh button to clean and transform the new report.
Thanks
Thank you to Cathy Benson for sharing her ugly MYOB report with me. And thank you to Excel MVP's, Ken Puls and Miguel Escobar, for teaching me the Modulo trick.


Thank you for this clear description of the steps. I used the same to sort some data I had, and after the modulo step, I had more rows (0,1,2,3).
I used the ‘Fill Up’ option to replace the null values in these columns and then followed the step of filtering out the ‘null’ value in the main column to get the data in a table.
Great to hear, Leo. Thanks for sharing.
Thanks for sharing this. I tried without looking at the steps shown by you and happy that the output matched with that of yours.
Here is my code.
let
Source = Excel.CurrentWorkbook(){[Name=”Table1″]}[Content],
#”Changed Type” = Table.TransformColumnTypes(Source,{{“Entitlements”, type text}, {“Value”, type any}}),
#”Filtered Rows” = Table.SelectRows(#”Changed Type”, each ([Entitlements] null and [Entitlements] “Total:”)),
#”Added Custom” = Table.AddColumn(#”Filtered Rows”, “Custom”, each if [Value] = “*None” then [Entitlements] else null),
#”Filled Down” = Table.FillDown(#”Added Custom”,{“Custom”}),
#”Filtered Rows1″ = Table.SelectRows(#”Filled Down”, each ([Value] null and [Value] 0 and [Value] “*None”)),
#”Reordered Columns” = Table.ReorderColumns(#”Filtered Rows1″,{“Custom”, “Entitlements”, “Value”}),
#”Changed Type1″ = Table.TransformColumnTypes(#”Reordered Columns”,{{“Value”, type number}})
in
#”Changed Type1″
Congratulations, Rudra! 🙂
Hi,
I have tried this using an entitlement report from my company’s MYOB file. The problem is, some employees have a balance for RDO’s and some don’t. MYOB won’t show a balance of $0 – it only lists the entitlement type if there is a balance. Therefore, when I get to step 6, the Modulo Index won’t work as there is not an identical number of records for each employee. Is there an additional step I can take to resolve this?
Thank you in advance,
Sarah
Hi Sarah,
Can you upload a sample file on our forum? It will be easier to find a solution for you. Create a new topic after sign-up to upload the file.
Regards,
Catalin
Hi Mynda
Thank you for the clear illustration. It was very helpful.
I took your Power Pivot and Dashboard courses. I learned skills and techniques that are proving very useful to me now.
I would like to know which program you used to record your material and illustration. I am mainly interested in know what you used to highlight sections in your presentation while explaining. That made understanding your explanations very easy.
I am always conducting presentations at work and would like to know how to make them more effective.
Thank you very much.
Bundu
Hi Bundu,
Great to hear you enjoyed my courses 🙂
I use Camtasia Studio by Techsmith to record my videos.
Kind regards,
Mynda
Thank you very much
Wow. I had to download Power Query. I wonder what other features I am missing.
Glad you like it, Heather. Chec kout Power Pivot next.
Mynda
Mynda:
Step six appears to have a typo, Modulo value s/b 2 , not 3.
Thanks for demonstrating the capabilities of Power Query. I have coworkers with 2007 who are quite jealous…
Thanks for spotting my typo, Glenn. All fixed now.
Power Query makes upgrading from Excel 2007 completely worthwhile. Let’s hope your co-workers can get it soon too.
This is so fantastic, wonderful video as always.
Could you show how when the new figures come do you apply the query to them.
Kind regards
Marg Pont
Hi Maggie,
Glad you enjoyed it.
I cover how to re-use queries in my Power Query course, but one option is to save a copy of the file and put your new data in the Excel Table that you linked to Power Query and simply Refresh.
Another is to open the Advanced Editor in the Power Query window > copy the M code and paste it into your new file, but that’s more complicated and is covered in a video in my course.
Kind regards,
Mynda