Last week I looked at getting real time data into Power BI using PubNub.
This week I want to take the same code and modify it slightly so we can get real time data directly into our Excel sheet.
This will require Excel 2016 or Excel 365.
I've previously written about creating add-ins for Excel (back then Microsoft called them apps), and I'll be using that process to create the add-in for this post.
At it's most basic our add-in consists of just two files. A HTML file which is the brain of the add-in, and the manifest file which tells Excel about the add-in and how to load it.
The add-in is really just a web page running inside Excel. So pretty much anything you can do in a web page, you can do in your add-in.
If your add-in requires a lot of CSS, JavaScript (or other language), you might want to split these into separate files, but if it's a simple add-in, you can keep the JS and CSS in the HTML file.
Set Up PubNub
I've already covered how to set yourself up with PubNub so won't go over that again here.
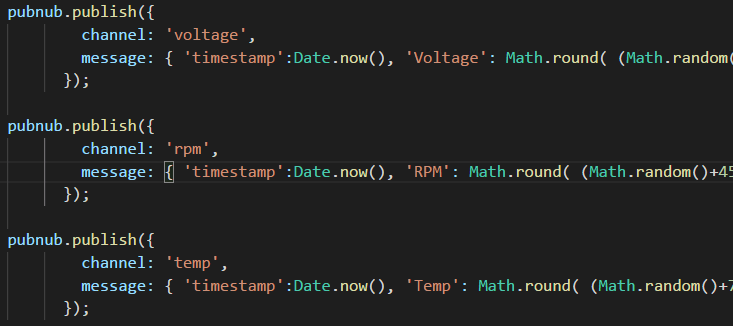
I've modified the PubNub Publisher file from the last post, to send a stream of dummy data for some imaginary sensors that are monitoring the voltage, RPM and temperature of an electric motor. Think of this as an example of how you can get real time data from an Internet of Things connected device into Excel.
To start the stream of data just open the file in your browser. Remember to enter your own pubKey in the code first.
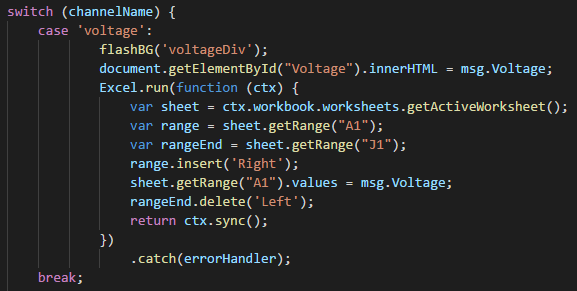
The Subscriber file has been modified to receive the new dummy IoT stream.
The data for each sensor is being sent down separate channels that we must subscribe to in order to receive the readings.
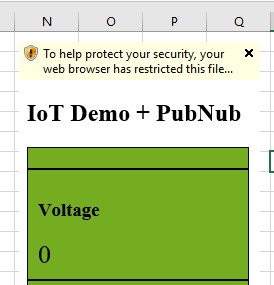
So that I know Excel is receiving data I'm using a simple display in the app pane so I can see that data as it arrives
This isn't strictly required as I could just write the data straight to the sheet. But it's nice to see and if I can see this changing but nothing happening in the sheet, I know something has gone wrong with my code to write the data into Excel.
To get the data into Excel I need to use the Excel JavaScript API.
For each of the sensor streams I'm going to keep the last 10 readings so that I can set up visualizations of the changes over time.
Creating the Add-In
As I've said, at its most basic our add-in merely consists of a HTML file and a Manifest file, which is XML.
But as I've written a fair bit of JavaScript, I'm also including a .js file which is loaded from the HTML.
Modify the Manifest
The manifest file tells Excel about the add-in. The information in it defines how the add-in works and the information that appears when you are loading it in Excel.
I've given it a unique ID, and entered a DisplayName and Description.
The icon that you will see when you are browsing for the add-in is our logo, which is loaded from our content delivery network.
The SourceLocation specifies where the HTML file is. Typically this would be loaded from a HTTPS web server but you can specify a folder on your PC like so:
Creating a Trusted Catalog
There are a number of ways to load the add-in into Excel. You can load it from a shared network drive, deploy it from Office 365, load it from Sharepoint, or you can load it from a folder on your own PC.
I'm going to load it from a folder on my PC but first I must set up this folder as a Trusted Catalog.
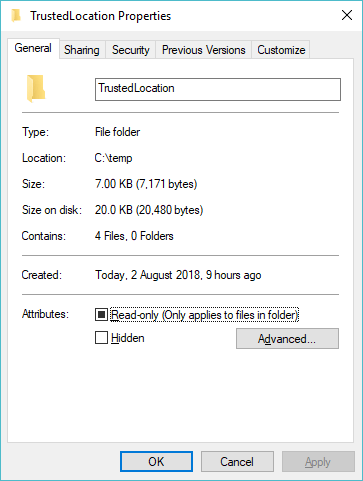
The first step is to decide where you want to store your add-in. I'm creating a folder in C:\temp\TrustedLocation
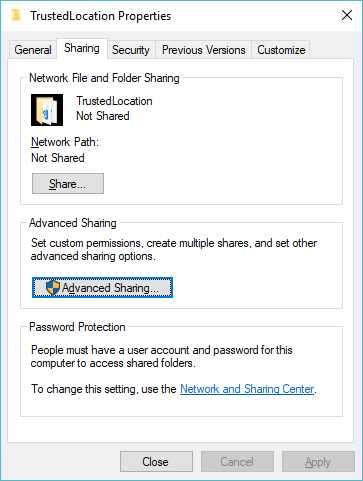
Right click on the folder -> Properties
Click on the Sharing tab
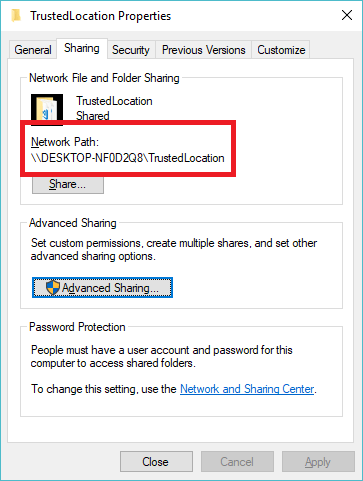
Click on Advanced Sharing. NOTE: If you just click on Share, the default permissions for Everyone will be read/write. But we don't want people changing our files.
Check Share this folder and click OK. Make a note of the Network Path, then close the folder properties box.
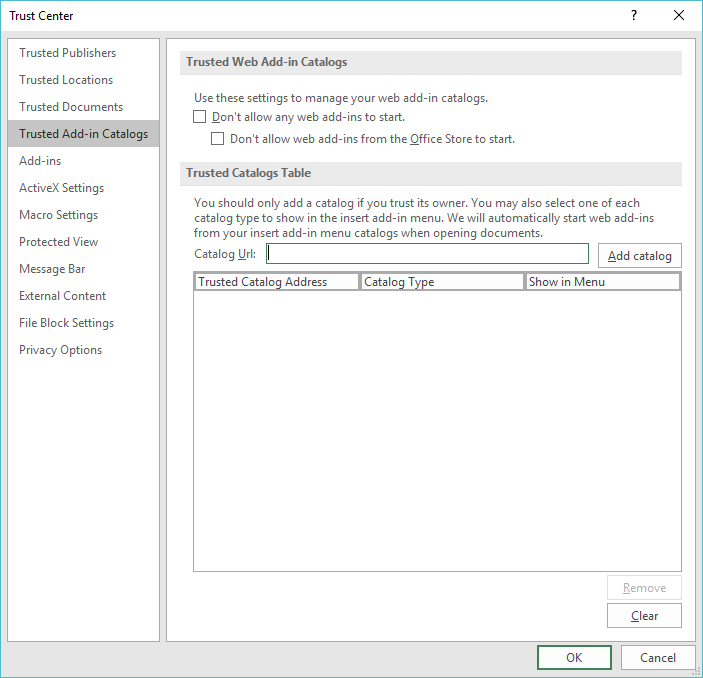
In Excel, go to the File menu -> Options -> Trust Center -> Trust Center Settings -> Trusted Add-In Catalogs.
In the Catalog Url box enter the network path you just noted and clickon Add catalog.
Check the box under Show in Menu and then cick on OK,and OK again to close the Excel Options.
Copy your add-in files to the shared folder. It's now ready to be used in Excel.
Using the Add-In
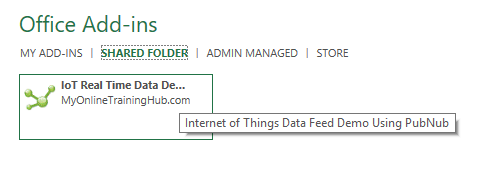
Back in Excel, click on the Insert tab on the Ribbon, then on My Add-ins.
Click on Shared Folder. If all is well you should see the add-in listed here.
Double click the add-in to load it into Excel.
If you get a security warning, click on that and click on Allow Blocked Content, then click on OK on the next warning you receive.
NOTE: If you put the HTML and JavaScript files on a secure (HTTPS) web server and then specify this as the SourceLocation in your manifest file, you won't get these security warnings.
The add-in is now loaded. But it's not receiving anything so open the Publisher file in your browser.
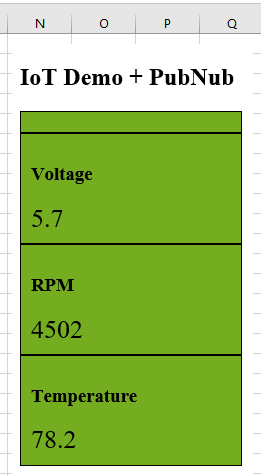
You should now see data being received in Excel.
The readings for voltage will go into A1:J1. RPM data into A3:J3 and temperature into A5:J5.
Visualizing the Data
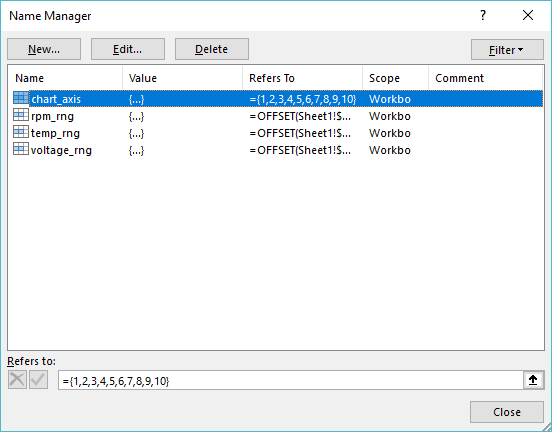
Due to the way I've had to get the data into Excel, I've created named ranges to refer to the cells the data is in.
As I am retaining the last 10 readings for each sensor, I need to store this information adding the newest data and removing the oldest each time a new reading is received.
Normally I'd do this in JavaScript using an array and then write the aray out to the sheet. But some of the standard JavaScript methods for arrays seem to throw errors when used in Excel, so I've had to resort to using the JavaScript API range methods .insert and .delete to manipulate the data directly in the sheet.
This has the effect that if we use the range A1:J1 in a sparkline, for example, the sparkline loses the reference to the cells the data is in due to adding and deleting cells in the row.
To overcome this I've used named ranges and the OFFSET function.
To create a named range for the voltages, I create a new name called voltage_rng and in the Refers To I'm entering
=OFFSET(Sheet1!$A$2,-1,,1,10)
Which means I want the name voltage_rng to refer to the cells that start 1 row up (-1) from cell A2 (which is A1 of course) and include 1 row and 10 columns. So A1:J1.
Similarly, I've created named ranges called rpm_rng and temp_rng.
When I create the sparkline I enter voltage_rng for the source data and do likewise for the sparklines for RPM and temperature.
Other Applications
With my sample files you can modify them to send any data you like to your sheet. Monitor the location of a fleet of vehicles. Report the status of the security systems in your home. Anything that you can get data for can be sent directly into your sheet in real time.
Get The Add-In Files
I've removed the add-in from the Excel workbook because if you tried to load it, you'd just get an error as the location Excel is trying to load it from is not available, because it's my PC.
You'll need to go into the manifest file, specify your own SourceLocation and put the HTML and JavaScript files there.
Enter your email address below to download the files.
