In this post I'm going to look at getting real time data (RTD) into Power BI using a real time messaging service called PubNub.
This is intended for use with the Power BI online service, not Power BI Desktop.
Power BI provides a few different ways to get RTD : Push Data, Streaming Data and PubNub Streaming.
Push Data
With this method, data is pushed, or sent, to Power BI and stored in a database that Power BI automatically creates.
Because the data is stored in a database, you can create reports using this data, as well as seeing the new data update in real time.
Streaming Data
Streaming data is also pushed to Power BI but by default the data is not stored in a database.
You can tell Power BI to store this streamed data in which case you can run reports and analyse the data stored in the Power BI database.
But if you create the dataset as a 'normal' streamed dataset, Power BI only retains the data as long as it needs to display it on a tile. You can't create reports for this data.
PubNub Streaming
PubNub is a data streaming network (DSN) that provides a real time messaging service.
Put another way, it's a high speed, low latency network that is built to allow you to easily send data from one place to another.
As with a lot of things that can be explained in a short, simple sentence, it is a very powerful concept.
Say you have an IoT device like a temperature sensor, or a GPS enabled vehicle, or maybe you've written an app that monitors your website's uptime, anything that can record or generate data and has access to the internet, can use PubNub to send that data to anybody or anything that you want to send it to.
As we are streaming data to Power BI from PubNub, there is no database created in Power BI to store the PubNub data. We can visualize the data in tiles, but we can't run reports against the data.
Pushing Data to Power BI Datasets
It's worth mentioning at this point that there are a few ways to actually push your data into Power BI.
You can write your own applications (programs) that use the Power BI REST API.
This will require a good knowledge of programming and is no easy task.
If you use Azure Stream Analytics (ASA) you can configure Power BI to receive data from ASA but this is also a daunting task for the non-developer.
The easiest approach is to use PubNub. It's pleasantly uncomplicated to do and although it does require some programming knowledge, or at least the will to give it a go, with the sample files I provide, hopefully you'll be able to get your own test system up and running in no time.
First Things First - Setup a PubNub Account
To use PubNub you'll need an account with them. They offer a free account for anyone interested in testing things out, so go and sign up now.
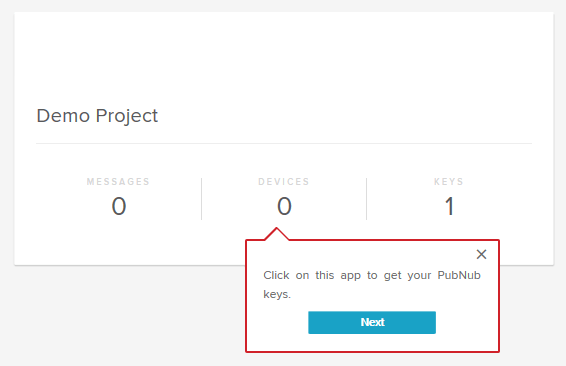
Once you are logged in, the first thing you should see is this which is telling you to go and get your API keys. You'll need these to send and receive messages (data).
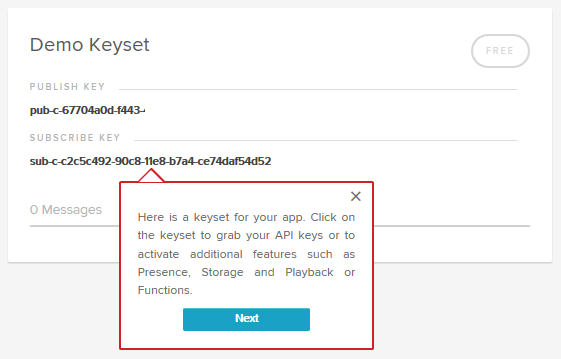
When you click on this you are shown your API keys
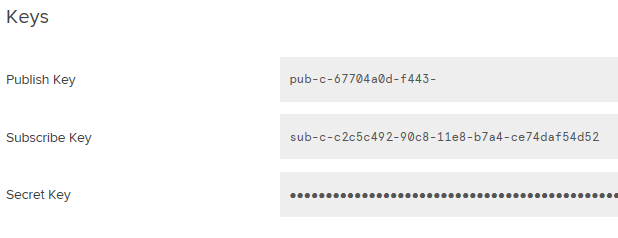
Please note that I have removed part of my Publish key to prevent naughty people sending data through my account. You should treat your own pub key carefully and don't give it to anyone you don't want sending data through your PubNub account.
Click on this again to go to the page where you can copy the keys.
When you have your API keys, you're ready to start sending some PubNub messages.
Sending Data via PubNub
The idea is that you create a 'channel' along which you can send data.
A channel is just a name you give to something in PubNub. You don't need to worry about what it really is or how it works, PubNub does all this for you. You'll see later how easy it is to setup and use.
Anybody or anything that wants to receive this data can connect to the channel and listen for your messages, so long as you give them the subscribe key.
The data you send can be any JSON serializable data, which means you can send numbers, strings, arrays or objects.
You can send binary data (images, sounds) or any UTF-8 character, either single or multi-byte.
All of this requires a little programming but PubNub provides sample code and SDK's (software development kits) for over 70 programming languages.
So it doesn't matter if you prefer Python, PHP, JavaScript, or something else. At least one of the languages you use is supported with sample code supplied.
I'm going to use JavaScript as it will run in your browser and makes demonstrating this much easier.
The Publisher
The code that sends the data, I'm calling the publisher. Remember the publisher can be anything. The computer monitoring the engine in your car. Your alarm system at home. If it has some data and can access the internet, you just need to hook it up with some code and you can send that data down a PubNub channel.
For my sample application I'm going to get the price in USD of Bitcoin, Ethereum and Litecoin from Crypto Compare, and send these prices down my channel where I'll read them with another piece of code I'll call my subscriber.
To get the prices of these crypto currencies I'm getting JavaScript to make a web request (load a web page) just like you would with your browser if you clicked a link or typed in a website address.
This is the website link I'm using https://min-api.cryptocompare.com/data/pricemulti?fsyms=BTC,ETH,LTC&tsyms=USD
If you click that you'll see the data my JavaScript code receives.
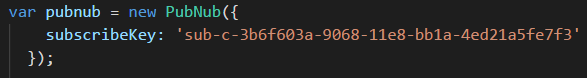
To begin with we need to insert into our code the keys we got earlier from our PubNub account.
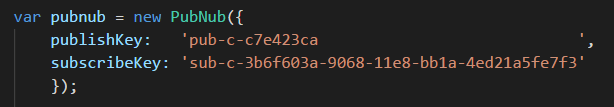
The publishKey allows us to create a channel and send messages. The subscribeKey allows us to receive messages. The subscriber part of the code only needs the subscribe key.
A function called mainApp() calls the Crypto Compare website and gets the prices in USD for the crypto currencies. It does this every 2000 milliseconds. You can change this value if you wish.
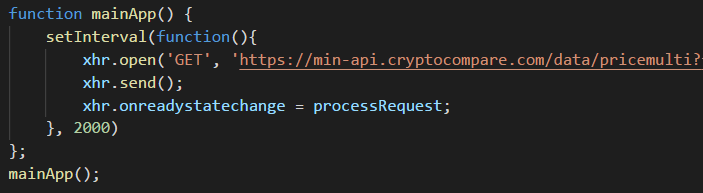
When we have these prices, this code in the processRequest() function sends the prices down the channels.
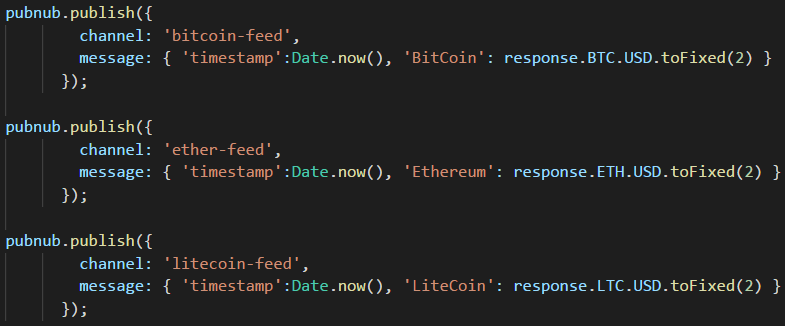
There's a channel for each crypto currency; bitcoin-feed, ether-feed and litecoin-feed. The act of sending data down a channel will create that channel if it doesn't already exist. You don't need to explicitly create a channel.
That is the whole thing. The JavaScript will continue to load prices every 2 seconds and sent the prices down the respective channels.
The Subscriber
Enter your subscribe key in the JavaScript (or whatever language you are using).
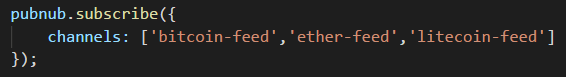
Tell the code what channels you want to receive data from by subscribing to them
Then listen for data and write some code to deal with the data when it arrives
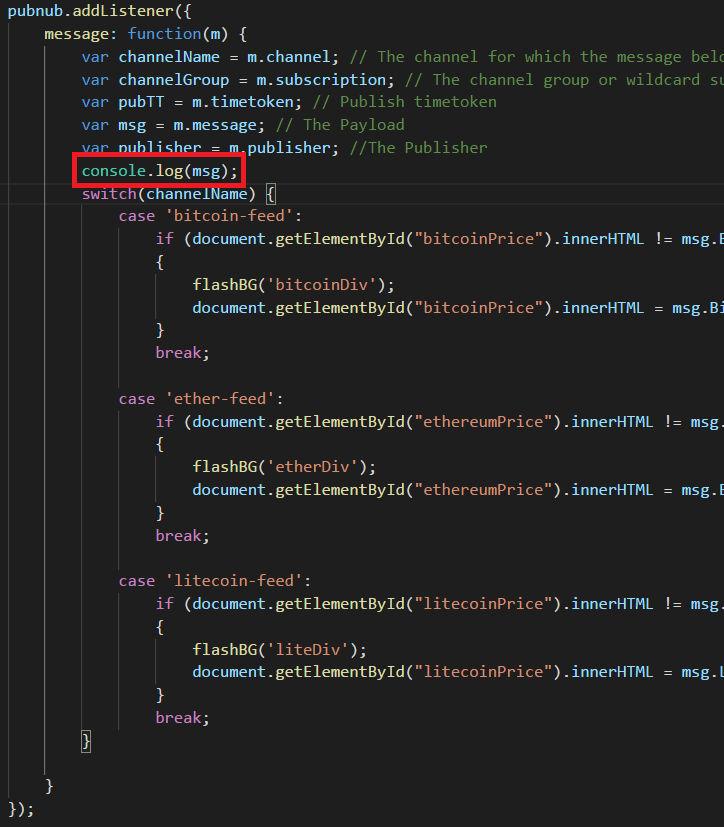
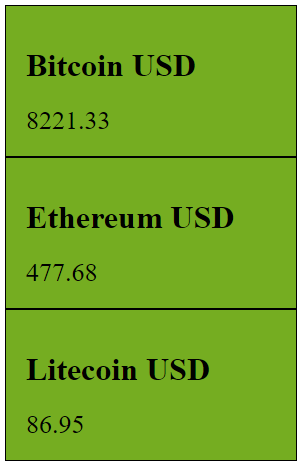
I've written some HTML and CSS to make the prices look nice when they are displayed in the browser, but you can make it as simple or as fancy as you like.
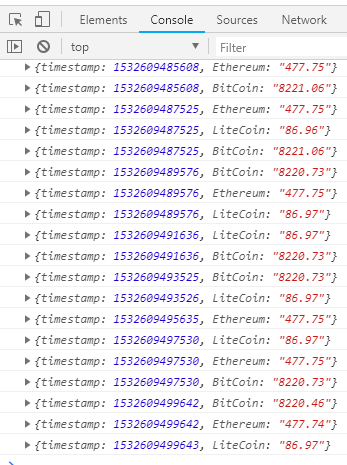
At it's most basic you can just write data to the JavaScript console in your web browser (see the line of code in the red box above) just to prove that the data is being received.
What we are aiming for is to receive this data in Power BI so you don't need to go nuts with your data presentation in the browser.
To see the console in your browser right click on the web page and choose Inspect Element. Then click on Console. You should see a stream of data like this.
Get The Files
Both the publisher and subscriber files can be downloaded. These are HTML files and can be edited with a text editor - don't use Word.
Once you enter your own keys into the files you can double click them to load in your browser and the code will start running.
Enter your email address below to download the files.
Getting the data Into Power BI
Now we have our publisher running, we can go back to Power BI and start receiving the data.
If you haven't already got a workspace then create one so you can keep things neatly organised.
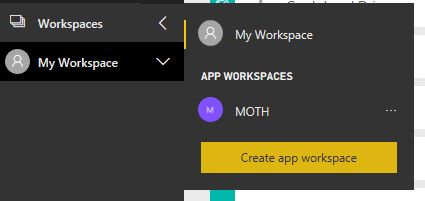
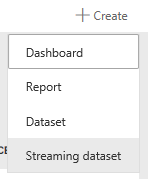
With your workspace loaded, click on Datasets and then on Create (at the top right)
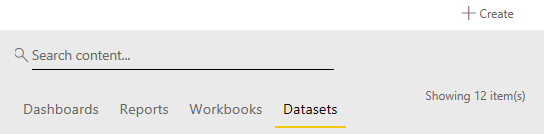
then click on Streaming dataset
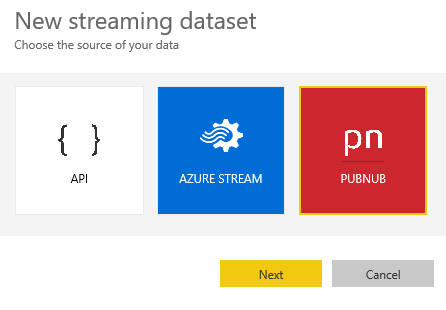
You will be presented with these options, click PubNub and then on Next.
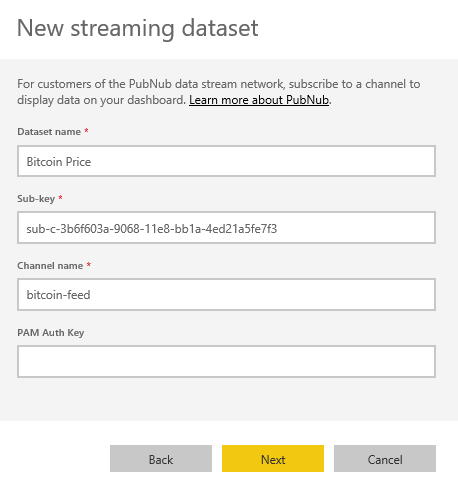
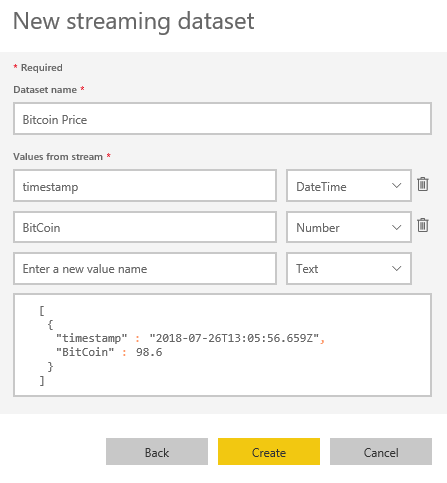
Give your dataset a name and enter the subscriber key and channel name, and click Next
If everything is OK and the publisher code is running, Power BI will be able to connect to the channel and receive some data whch it will present like this.
If there's a problem, Power BI won't receive any data and it will give you an error. If that happens, check that you have entered the sub key and channel name correctly and that the publisher code is running in your browser.
After clicking Create you should now have a new streaming dataset. For this example, if you want to get the prices for Ethereum and Litecoin into Power BI, you'll need to create datasets for both the Ethereum and Litecoin streams.
Creating a Dashboard
With the streaming dataset created we can now use it in a dashboard.
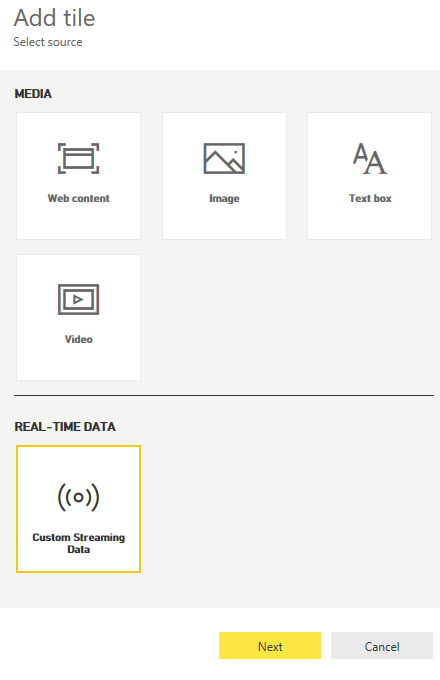
Create a new dashboard then click on Add tile (top right of the Power BI screen).
Click on Custom Streaming Data and then click on Next.
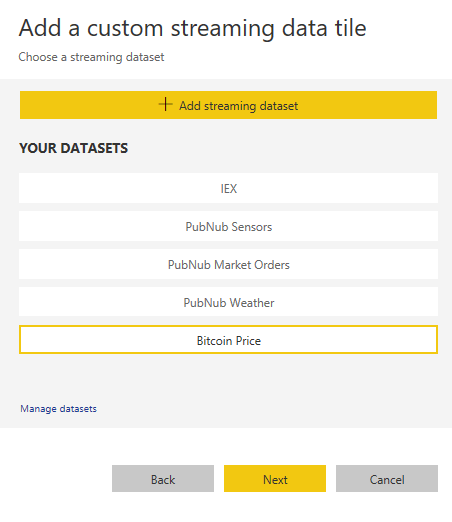
Select the dataset you just created and then click Next.
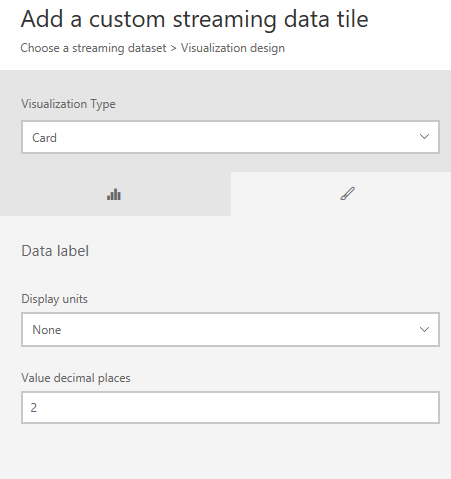
I'll use a Card visualization, and there's only one field to display
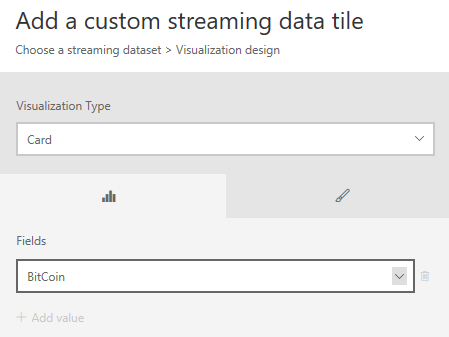
Set the Display units to None and we'll use 2 decimal places, click Next.
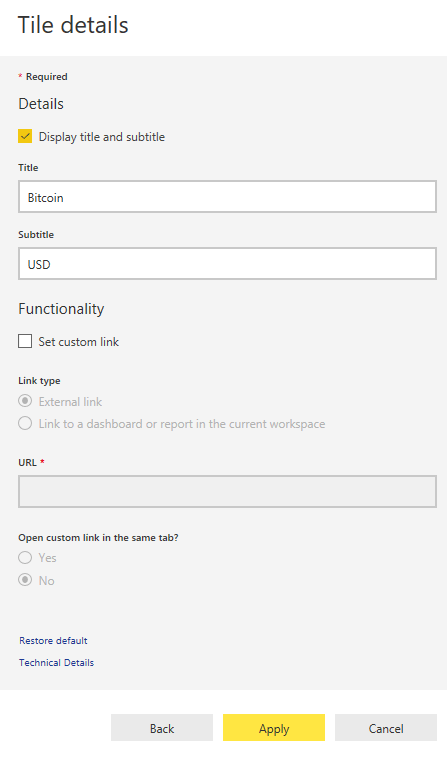
Add a title and sub-title if you wish, and click Apply to finish.
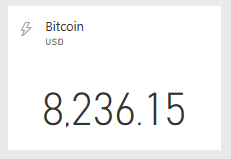
You should now have a tile showing real time updates for the price of Bitcoin in USD.
Conclusion
Using PubNub is a lot easier than writing code to use the Power BI API to get real time data into your dashboards.
Even if you only have a little bit of knowledge of how to program it's worth giving it a go to see what you can do.
Check with your data provider to see if they publish their data to PubNub.
PubNub provide some sample streaming datasets too so you don't need to do any programming if you just want to connect Power BI to one of them and get a feel for how you might use PubNub.

Interesting article; thank you! Not being familiar with Javascript, I had some catch-up to do. Also didn’t realize the article is intended ONLY for Power BI Service users and not for Power BI Desktop users. Too bad.
Good point Paula, I’ve added a note to make it clear this is for PBI Service Online