Updated April 27th 2023
Standard Deviation in Excel is super easy to calculate, and we have separate functions for the standard deviation of a sample or a population.
I'm not going to go into too much detail on what the standard deviation measures, because if you’re reading this you probably already know that it is a measurement of confidence, variability or diversity in the average (be it the mean or another expected value) used in statistics and probability theory.
We use it in my book club to indicate the polarity of our scores for each book. Whilst some books might score high overall they may also polarise the group, with some LOVING the book and others HATING it.
A high standard deviation indicates there is a wide range of scores. A low standard deviation indicating most were in agreement.
Here’s an example of how we use the Standard Deviation function in Excel to analyse our book scores:

Download the Workbook
Enter your email address below to download the sample workbook.
Download the Excel Workbook and follow along. Note: This is a .xlsx file please ensure your browser doesn't change the file extension on download.
Watch the Video

Functions for Standard Deviation in Excel
For a sample of the entire population use:
=STDEV.S(number1,[number2]….)
For an entire population use:
=STDEV.P(number1,[number2]….)
You can either enter all the numbers separated by commas or you can enter a cell range (e.g. $D$3:$D$500) or a named range.
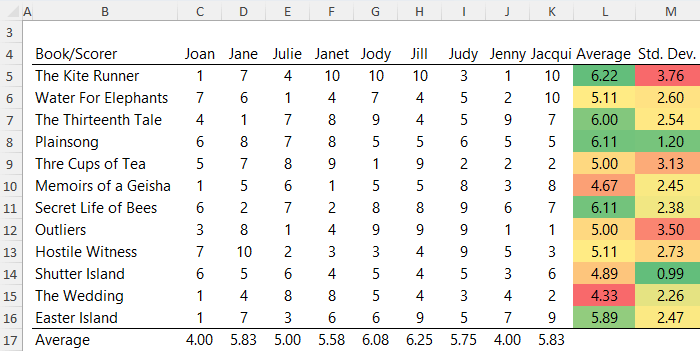
Using row 5 in the image below, our formula in cell M5 would read:
=STDEV.P(C5:K5)

Interpreting the Standard Deviation
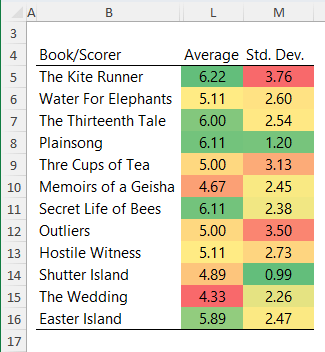
We can see that on average the top scoring book was The Kite Runner with a score of 6.22, but it was also the most polarising book with a standard deviation of 3.76.
Plainsong tied for second, and with a standard deviation of just 1.20 most of the readers were in agreement. You could even argue that this was the best book since it pleased most of the book club members!
Shutter Island was one of the lowest scoring books with an average of just 4.89, and with a standard deviation of 0.99 most were in agreement.
In the Average and Std Dev columns (L & M) I have used conditional formatting to help with the readability of the table.


thank you
مجهود جيد
Thanks
thank you
You’re welcome, Lela 🙂
I am very curious to know excel functions
I believe, your search ends here, Moniruzzaman….thank Mynda and this website
🙂 Cheers, Shyam!