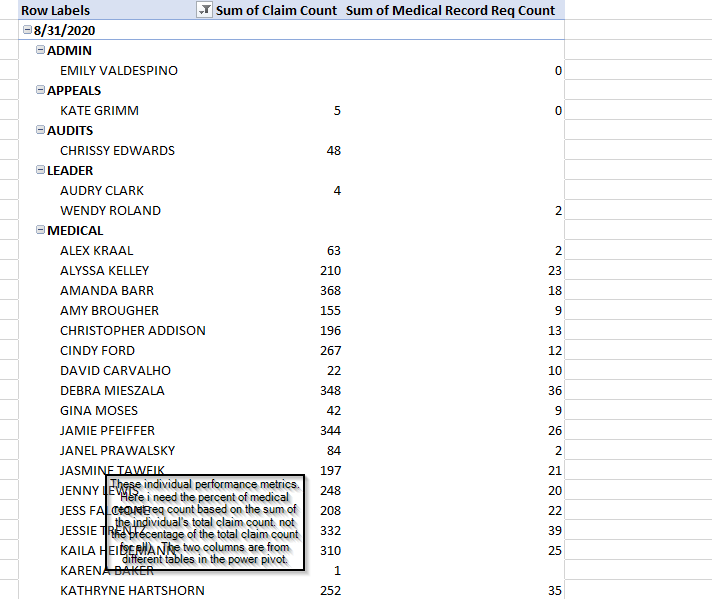
Hello- I have several report I'm trying to get into a PowerPivot type thing for an eventual dashboard and need to compare the percentage of one column on one report to another column on another report. I've done this on regular pivot tables by created a calculated field. But that is grayed out here in PP. I've tried the 'show values as' but it's not giving me the option of showing the values as a percent of the first column. I've attached a pic of the first pivot with the grayed out calculated field button. Any thoughts? I can't attach the whole file as it's too big.
nh
Hi Nancy,
Please see this tutorial on showing the percentage of another PivotTable column using Power Pivot.
Mynda
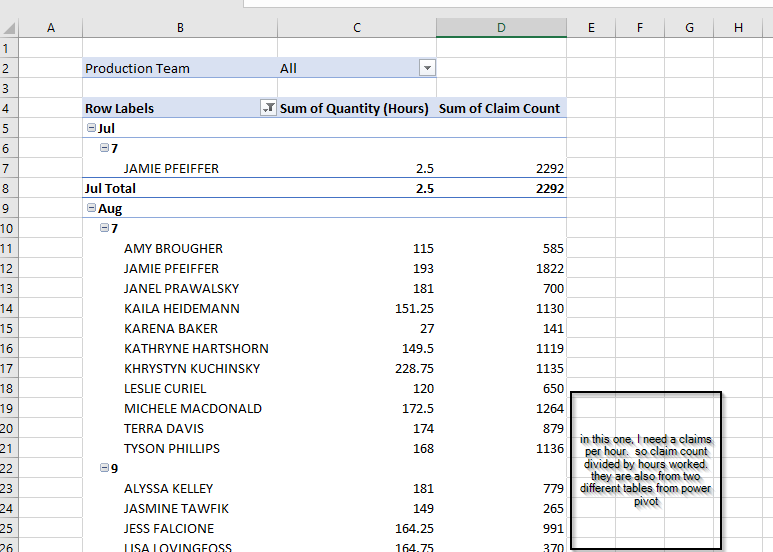
Hi again! I've been poking around with using measures and I'm not finding what I need. They are just basic arithmetic outputs I need to come up in a calculated column field like regular pivot table will do so I can use them in graphs. The initial question was for a percentages of the first column not of the overall total. The second one is for a production rate (claims per hour). I tried using calculate with just something like this
claims per hour:=calculate('new claims entered'[claimcount]/'raw production data'[quantity(hours)])
but it's doesn't return the calculation and gives an error. I am looking for basic calculated fields like summing two columns or dividing one column by another but the columns are from different sheets. Was hoping Power Pivot could do this. I cut/pasted some pictures with a little more detail and attached them.
Thanks!
nh
Hi Nancy,
No pictures attached, perhaps you missed to click the Star Upload button.
It is better though if you can upload a file with sample data, so we get a better chance to find a solution that works as you want.
Br
Anders


Hello- sorry, I must not have pressed the 'upload' button. I've tried to attach the file, but it's too big to upload here.
nh
Hi Nancy,
I can see that you are very new to Power Pivot because that's now how to write a CALCLULATE formula. The best way for us to help you is for you to take an extract of your data that illustrates the overall dataset (anonymise it if necessary), create your relationships and PivotTable and then upload the file. From there we can insert the DAX measures into your file so you can see what needs to be done.
Mynda
