All,
Going down the rabbit hole.
Excel 2019.
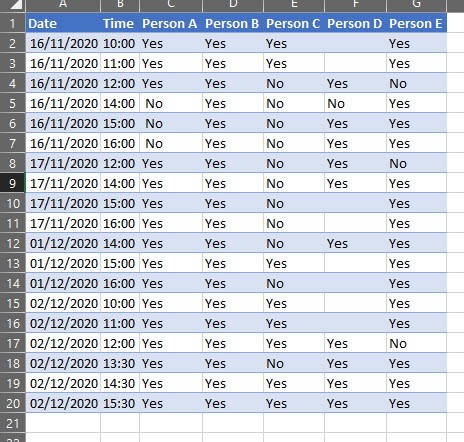
Initial data from a Word Table. Done a lot to get it into an excel table. Now needs 'reporting' on. (extable-01is one option for an excel table to at least use as a reporting basis).
Default table (filtering) doesn't work as includes No responses.
Pivot Table, returns counts/sums not names.
Has to be easy and updatable by end user..
End Goal: which people i.e. Names will attend session(s) on day(s) x and time(s) x.
I've tried transposing the data. Thus Names are rows, Date, time are columns. Yet similar outcome.
Wondering if I will need an excel table for date/time options. another one for Names and then somehow lookup for response.
If it was a database, I think there would be individual name, date, time, response columns. That would increase my table a lot. I could do it, yet still not sure how to answer the end goal i.e. who is coming to the 16/11/2020 session at 14:00. Blanks mean no response.
Thanks
It probably needs un-pivoting to make it in to proper data.
I am no expert but belive that can be done in power query - can you upload a file rather than a picture so we can give it a go?
Purfleet is right. The data needs unpivoting. Please supply a sample file and mock-up of the layout you'd like in your report so we can help you further.
Wouldn't it be easier to merely create two filters, one for date and one for time. With two clicks, the attendees would be listed and a simple counta function on the rows would give the count.
Sorry all,
Thought I'd attached files.
Dummy Data is how I received the information.
Data and Report is how I think it should be presented.
Thanks
A
Hi Andrew,
In the attached file I used Power Query to unpivot and clean the data. Then I inserted a PivotTable with Slicersto generate the report. See the sheet called Table1.
Mynda
Thanks, PQ isn't something I've got into yet. I'll check this all out.
Thank you so much.
A
