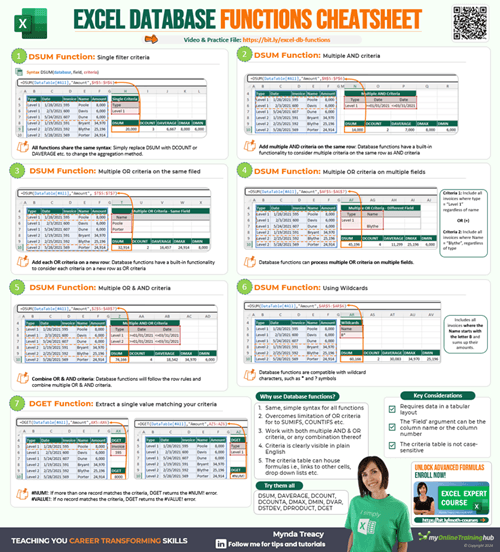
Excel Database functions have been around for donkey's years so it's surprising that not many people know about them. They work great with tabular data and Excel Tables.
They're not only easier to use and more powerful than more popular equivalent functions like SUMIFS, COUNTIFS etc., but they can get around some of their limitations.
Table of Contents
Watch the Video

Get the Example Workbook and Cheat Sheet
Enter your email address below to download the sample workbook.
Excel Database Functions
There is a database function for nearly every aggregation type, from average through to variance, as listed below. They're an alternative to SUMIFS, AVERAGEIFS, MINIFS etc. except more powerful.
| Function | Description |
| DAVERAGE | Returns the average of selected database entries |
| DCOUNT | Counts the cells that contain numbers in a database |
| DCOUNTA | Counts nonblank cells in a database |
| DGET | Extracts from a database a single record that matches the specified criteria |
| DMAX | Returns the maximum value from selected database entries |
| DMIN | Returns the minimum value from selected database entries |
| DPRODUCT | Multiplies the values in a particular field of records that match the criteria in a database |
| DSTDEV | Estimates the standard deviation based on a sample of selected database entries |
| DSTDEVP | Calculates the standard deviation based on the entire population of selected database entries |
| DSUM | Adds the numbers in the field column of records in the database that match the criteria |
| DVAR | Estimates variance based on a sample from selected database entries |
| DVARP | Calculates variance based on the entire population of selected database entries |
Database Function Example 1 - How DSUM Works
DSUM syntax
=DSUM(database, field, criteria)
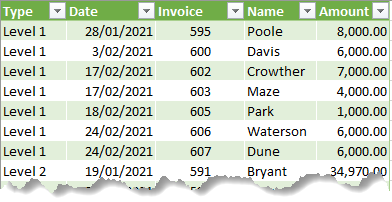
Taking the data below stored in an Excel Table called 'DataTable', let’s say I want to SUM the amounts for all Level 1 invoices:
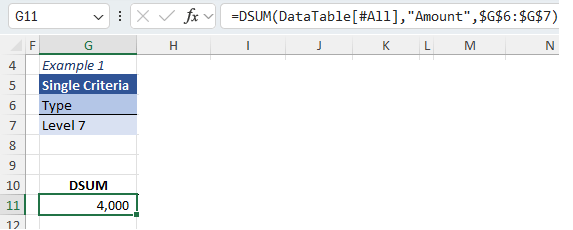
The second argument for DSUM is the criteria. This is stored in cells in the workbook (on any sheet):
And the formula would be written:
=DSUM(DataTable[#All],"Amount",$G$6:$G$7)
database
= DataTable[#All]. This is a Table Structured Reference for my tabular data set including the column labels, hence [#ALL] in the reference. Alternatively, I could type in the cell range A4:E70 (including column labels).field
= "Amount". This is the name of the column I want to sum. This could also be the column number of the data table, in this example, 5.criteria
= $G$6:$G$7. This is the range of the criteria table
Database Function Example 2 - Multiple AND Criteria
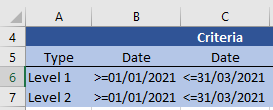
Let’s say I want to SUM all Level 1 invoices for the period January – March 2021. When working with 'AND' criteria, they go across the columns in a single row like this:
Note: my dates are dd/mm/yyyy. Please change the dates in the criteria table to suit your Excel region settings.
Then my database formula is:
=DSUM(DataTable[#All],"Amount",$A$5:$C$6)
Result = $38,000 which represents the sum of the amount column in my table for Level 1 for the period January to March 2021.
Database Function Example 3 - Multiple AND OR Criteria
Ok, what if I wanted to SUM both Level 1 AND where dates are between January AND March, OR for Level 2 where dates are between January AND March?
Easy, add another line to your criteria table like this:
Remember to also update your DSUM formula to include the new row of criteria:
=DSUM(data_table,"Amount",$A$5:$C$7)
Result = $229,151 which is summing Level 1 and Level 2 amounts that are in the date range January – March 2021.
But wait, there’s more. Database functions aren’t limited to SUM. You can AVERAGE, COUNT, COUNTA, MAX, MIN and more.
They all use the same syntax, and they can all use the same criteria table.
=DCOUNT(data_table,"Amount",$A$5:$C$7)
– result 15
=DAVERAGE(data_table,"Amount",$A$5:$C$7)
– result $15,277
=DMAX(data_table,"Amount",$A$5:$C$7)
– result $34,970
=DMIN(data_table,"Amount",$A$5:$C$7)
– result $1000
You don’t even need to remember complicated acronyms for these functions. Just add a ‘D’ to the front of the function you want.
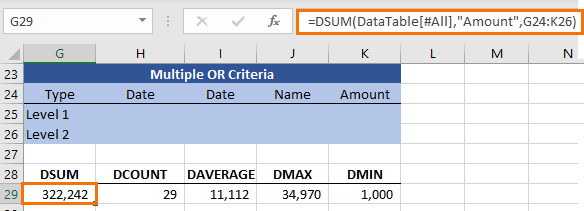
Database Function Example 4 - Multiple OR criteria, same field
The takeaway here is 'OR' criteria are listed down the rows, whereas 'AND' criteria are listed across the columns of a single row.
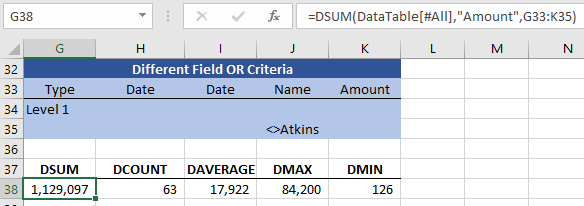
Database Function Example 5 - Multiple OR criteria, different field
This criteria will aggregate all data which is level 1, including level 1 for Atkins (because the name field is blank on the first criteria row), plus all other levels except those that are for Atkins (because the Type field is blank on the second criteria row).
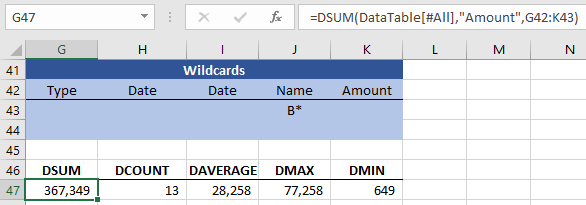
Database Function Example 6 - Wildcards
Database functions can also handle wildcards. Here I want to aggregate all data where the names begin with B.
Notice this time I used the column number in the field argument instead of the column name.
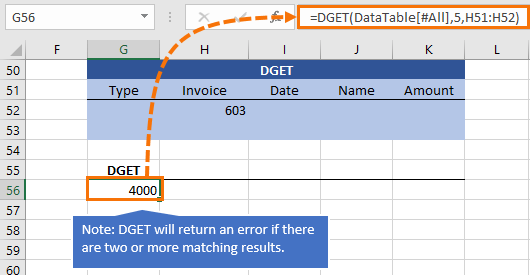
Database Function Example 7 - DGET Function
Unlike the other database functions which aggregate data, the DGET function only returns a single value. If your result returns more than one matching record you'll get the #NUM! error.
Excel Database Function Rules
- Your criteria table only needs columns for the data you want to filter on. So, if your tabular data set has hundreds of columns, don’t panic. You don’t need every column replicated again in your criteria table.
- You can add multiple 'OR' criteria by adding them to a new row in your criteria table.
- If your Database formula includes criteria rows that are blank then it will sum/average/count etc. the whole table. Essentially ignoring your criteria altogether.
- The criteria table can house formulas e.g. links to other cells, drop down lists and the like, so get creative with how you use them to incorporate interactivity into your reports.
- The Criteria table is not case sensitive, not for the column labels or the criteria itself.
- The ‘Field’ part of the formula can be the column name or the column number.
The Downside of Excel Database Functions
The obvious downside is that the Database Functions require a bit more worksheet real estate to house the criteria as opposed to an array formula and the like, but with over 1 million rows I think we can afford it.
I think the upsides, like the fact that you can see exactly what the criteria is in plain English and how easy they are to use far outweighs the downside.
Next Steps
If you’re finding these Excel functions useful, and you want to take your skills even further, check out my Advanced Excel Formulas course. It's packed with all the functions that will save you hours of work and help you stand out.
What’s great about this course is that it doesn’t just cover the basics—it dives into real-world examples with quick, bite-sized videos, showing you both the fundamentals and more advanced, less obvious uses of functions.
Once you’re done, you’ll have a solid understanding of how to create robust formulas that enable you to handle any scenario.




This is really neat.
Is there a way to nest with sumproduct? It would be great if i could do it for all my expense categories on a P&L.
Thanks!
Matt
Not sure why you’d need to nest it with SUMPRODUCT. Please post your question on our Excel forum where you can also upload a sample file and we can help you further.
nice thanks’
Glad you liked it, Imran!
Very nice
Thanks, Irfan!
Good
Hi,
Its really a useful tips. Just want to know if I want to multy two coloumns then what needs to be done
Thanks
Hi Kamala,
I don’t think database functions are appropriate of multiplying two columns simply because DPRODUCT cannot accept two fields or more as arguments.
You can use 2 DGET FUNCTIONS though just to work it around but then if you have plenty of record that meets the criteria then you’ll also get
an error.
Please send your further clarifications via HelpDesk because I see that Database Functions is not what you really wanted here.
Sincerely,
CarloE
Hi Mynda,
Using the above table, how would I go about listing the entire table greater than 1000?
This way level 7 would not be included and the list would look something like
Level 1 $38,000
Level 2 $26,154
Level 3 $……..
Level 4 $……..
Level 5 $……..
Level 6 $…….
Level 8 $……..
Then to add some spice, if we had the same table on multiple sheets and wanted the list to SUM all the tables as above into the one list? Meaning the one list contained the results of the SUM of the different tables on multiple sheets.
Hi Bob,
I would greatly appreciate if you would send a file through Help Desk containing all the data and a short explanation of your desired results.
I could think of using a Pivot Table right now but I need your file.
Sincerely,
CarloE
Dear Mynda,
thanks for this. very useful. but the workbook you uploaded once i click on the sheet Database Functions G5 and press enter then the amount that was previously shown as result of DSUM formula disappears.
would appreciate your feedback on this issue.
thanks.
Jamil
Hi Jamil,
I’m not sure why this would be happening. The only thing I can think of is that you haven’t clicked on the ‘enable workbook’ button above the formula bar when you first open the workbook.
Kind regards,
Mynda.
Hi Jamil,
I believe it’s been a while and you might have found your find your answer already. I’m just putting this here for anyone else trying to find the answer to the same question.
If your system or Excel dates are formatted as “mm/dd/yyyy” you need to change the date criteria in the cells I7, I16, and I17 to <=03/31/2021 instead of <=31/03/2021 to match your date formating.
This should take care of the problem.
Regards,
M.Bakr