
Many teams pay for tools like Asana, Monday, or Notion just to manage a simple project timeline.
The reason is not that Excel cannot do it. It is because most attempts to build a Gantt chart in Excel end up looking confusing, fragile, or difficult to maintain.
In this tutorial you will learn how to build a clean, modern Gantt chart in Excel that automatically updates when dates change and visually tracks progress on every task.
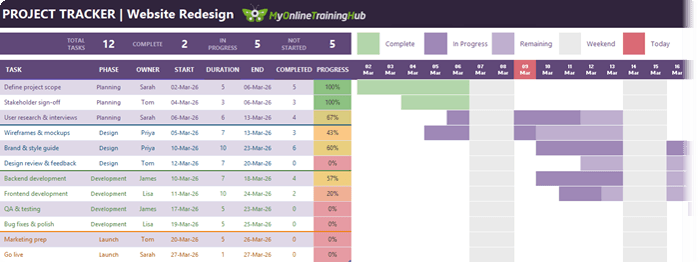
The entire chart runs on just three inputs:
• Start date
• Duration
• Progress
Once those values are entered, everything else updates automatically.
By the end you will have a dynamic project tracker that you can use immediately at work.
Table of Contents
- Watch the Excel Gantt Chart Video
- Get the Excel Gantt Chart Template
- What Is a Gantt Chart?
- Step 1: Create the Project Task Table
- Step 2: Add Drop Down Lists for Faster Data Entry
- Step 3: Calculate the End Date Automatically
- Step 4: Track Task Progress
- Step 5: Generate the Project Timeline Automatically
- Step 6: Build the Gantt Chart with Conditional Formatting
- Step 7: Show Completed Work Inside the Gantt Bar
- Step 8: Highlight Completed Tasks
- Step 9: Shade Weekends
- Step 10: Highlight Today's Date
- Step 11: Add Visual Progress Indicators
- Step 12: Add Project Summary Metrics
- Step 13: Add a Legend
- Final Result
- Take Your Excel Skills Further
Watch the Excel Gantt Chart Video

Get the Excel Gantt Chart Template
Enter your email address below to download the free file.

What Is a Gantt Chart?
A Gantt chart is a visual project timeline.
It shows:
• What tasks need to be completed
• Who is responsible for each task
• When each task starts and ends
• How much progress has been made
Instead of scanning through rows of dates, the timeline is displayed visually so you can instantly understand the project schedule.
Step 1: Create the Project Task Table
Start by building a simple table that contains the core details for each task.
Create the following headers (modify them as required):
TASK
PHASE
OWNER
START
DURATION
END
COMPLETED
PROGRESS
Enter the tasks for your project underneath the Task header.
For example:
Define project scope
Stakeholder sign off
User research and interviews
Wireframes and mockups
Brand and style guide
Design review and feedback
Backend development
Frontend development
QA and testing
Bug fixes
Marketing preparation
Go live
Once the task list is complete, convert the range to an Excel Table.
Select the data and press: Ctrl + T
Ensure the “My table has headers” option is selected.
Tables are important because they automatically expand when you add new tasks and they fill formulas down automatically.
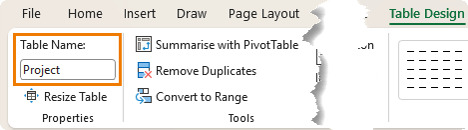
Via the Table Design tab, rename the table to: Project (or a name that reflects your project). You can do this in the Table Design tab:
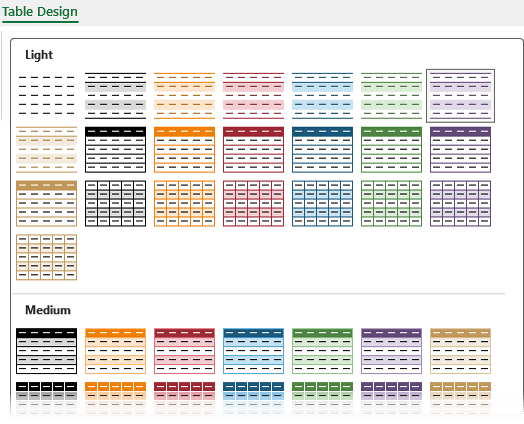
Tip: choose a table style in keeping with your company branding or project theme:
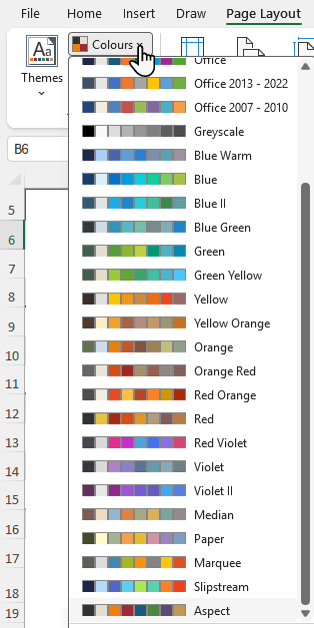
Note: my colour theme is Aspect. Change it from the Page Layout tab:
Step 2: Add Drop Down Lists for Faster Data Entry
Typing the same values repeatedly slows data entry and introduces mistakes.
Instead, add drop down lists using Data Validation.
For the Phase column:
Data → Data Validation → List
Source: Planning,Design,Development,Launch
Now every row contains a drop down for quick selection.
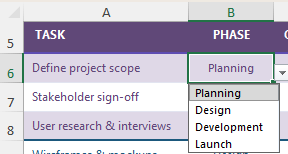
Repeat the same process for the Owner column.
Example list: James,Lisa,Priya,Sarah,Tom
Now assigning tasks becomes just a few clicks.
Step 3: Calculate the End Date Automatically
The end date should be calculated based on:
• Start date
• Task duration
• Working days only
Use the WORKDAY.INTL function:
=WORKDAY.INTL([@START]-1,[@DURATION],1)
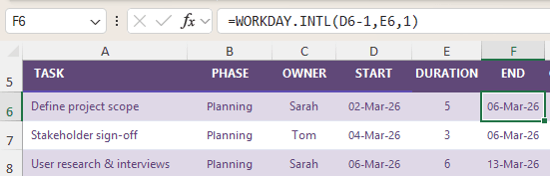
Explanation:
The start date minus one ensures the first working day is included.
The duration determines how many working days are added.
The value 1 specifies Saturday and Sunday as weekend days.
Because the formula is inside a table, Excel automatically fills it down the entire column.
If the start date or duration changes, the end date updates instantly.
Step 4: Track Task Progress
Next add progress tracking.
The Completed column represents the number of work days already finished for that task.
This value cannot be calculated automatically because it depends on how your team measures progress.
For example:
If a task takes 10 days and about 3 days of work have been completed, enter 3.
Next calculate the progress percentage.
Use this formula:
=[@COMPLETED]/[@DURATION]
Format the column as Percentage.
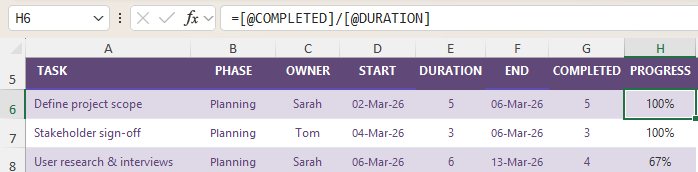
Whenever the completed value changes, the progress updates automatically.
Step 5: Generate the Project Timeline Automatically
Instead of manually typing dates across the worksheet, generate them dynamically using the SEQUENCE function.
Enter this formula in the first timeline cell:
=SEQUENCE(
1,
MAX(Project[END])-MIN(Project[START])+1,
MIN(Project[START])
)

Explanation:
1 in the first argument represents one row of values.
The number of columns equals the project length calculated from the earliest start date to the latest end date.
The sequence begins at the earliest start date.
This creates a dynamic project calendar that expands automatically if the schedule changes.
Create a custom number format for the dates so the day and month appear on separate lines.
Example format:
dd
mmm
Enter Ctrl+J after ‘dd’ to force a line break. Enable Wrap Text and narrow the columns so they resemble a timeline grid.
Step 6: Build the Gantt Chart with Conditional Formatting
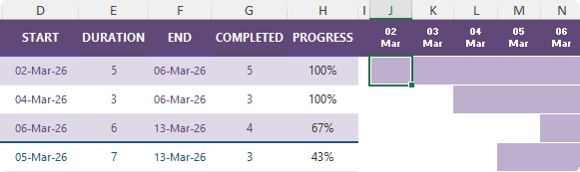
The Gantt chart itself is simply a grid that fills with colour when a timeline date falls between a task's start and end date. We’ll use Conditional Formatting formulas to automatically fill the colours.
Select the entire grid where tasks intersect with timeline dates.
Create a new conditional formatting rule using a formula:
=AND(J$5>=$D6, J$5<=$F6)
Explanation:
The date in the header must be greater than or equal to the task start date.
The date must also be less than or equal to the task end date.
Apply a light fill colour.
Excel now draws the Gantt bars automatically across the calendar.
Step 7: Show Completed Work Inside the Gantt Bar
Next highlight the portion of work that has already been completed. With the entire grid selected, add another conditional formatting rule:
=AND(J$5>=$D6,
J$5<=WORKDAY.INTL($D6-1,$G6,1))
Apply a darker fill colour.
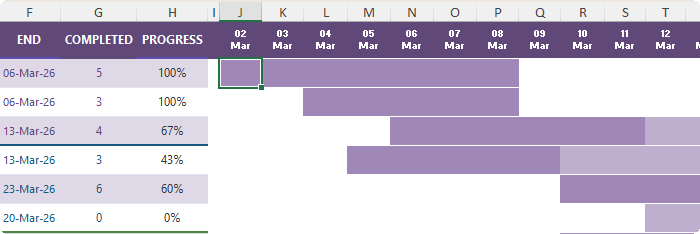
Now as the completed value increases, the darker section expands across the timeline.
This creates a visual progress indicator inside the Gantt chart.
Step 8: Highlight Completed Tasks
You can also highlight tasks that are fully finished in a different colour.
Create another rule:
=AND($H6=1,
J$5>=$D6,
J$5<=WORKDAY.INTL($D6-1,$G6,1))
Apply a green fill.
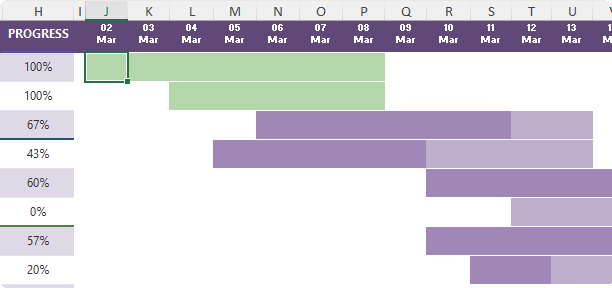
Tasks automatically turn green once progress reaches 100 percent.
Step 9: Shade Weekends
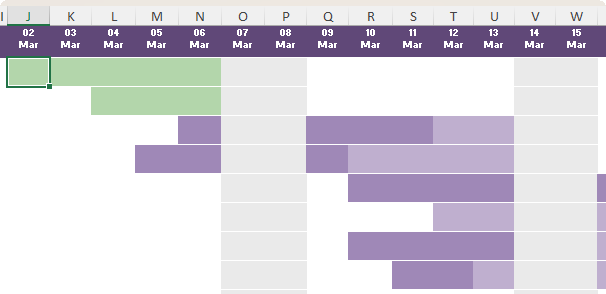
Weekend shading makes the schedule easier to read.
Create another conditional formatting rule:
=WEEKDAY(J$5,2)>=6
Explanation:
The return type of 2 makes Monday equal to 1 and Sunday equal to 7.
If the value is 6 or 7, the day is Saturday or Sunday.
Apply a grey fill colour.
Step 10: Highlight Today's Date
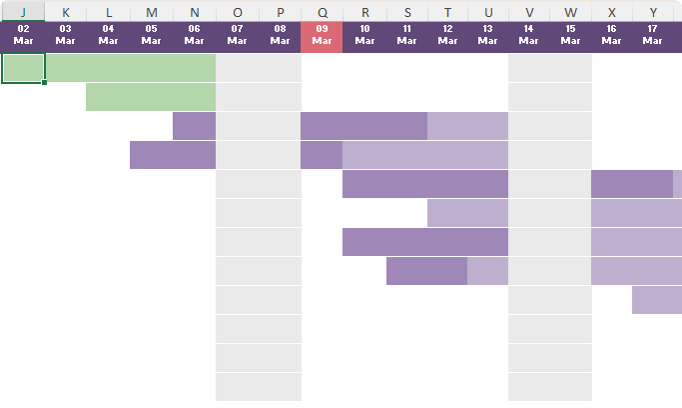
Add a visual indicator for today's date.
Create a conditional formatting rule:
=J$5=TODAY()
Now the chart automatically highlights the current date every day.
Step 11: Add Visual Progress Indicators
In the Progress column, apply a color scale under Conditional Formatting.
Adjust the colours to match your theme.
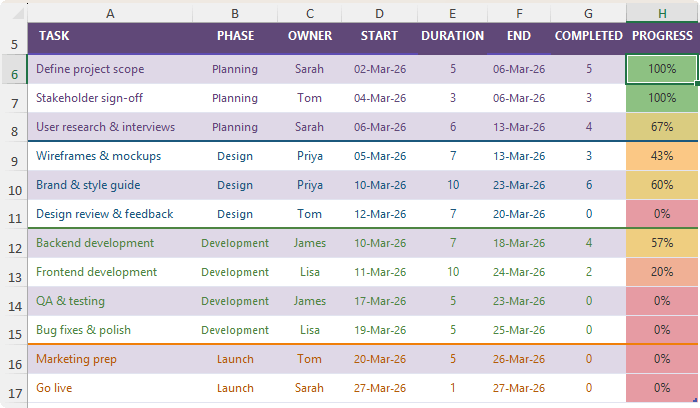
Tasks that are finished appear green while tasks just starting appear orange and tasks not started appear red.
This makes it easy to assess project status at a glance.
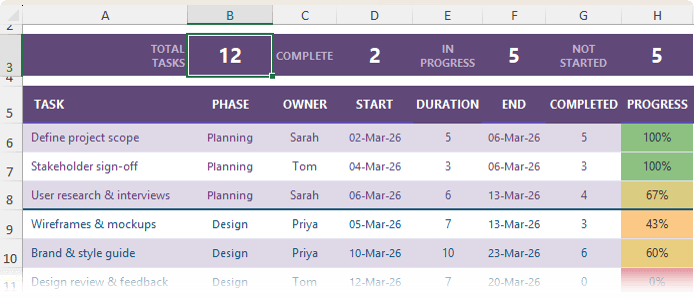
Step 12: Add Project Summary Metrics
You can also add quick statistics at the top of the tracker.
Total tasks:
=COUNTA(Project[TASK])
Completed tasks:
=COUNTIF(Project[PROGRESS],1)
Tasks in progress:
=COUNTIF(Project[PROGRESS],">"&0)-D3
Tasks not started:
=B3-D3-F3
These metrics provide an instant overview of project status.
Step 13: Add a Legend
Insert cell fill colours and label what they represent, so it’s easy for your audience to interpret the Gantt bars:
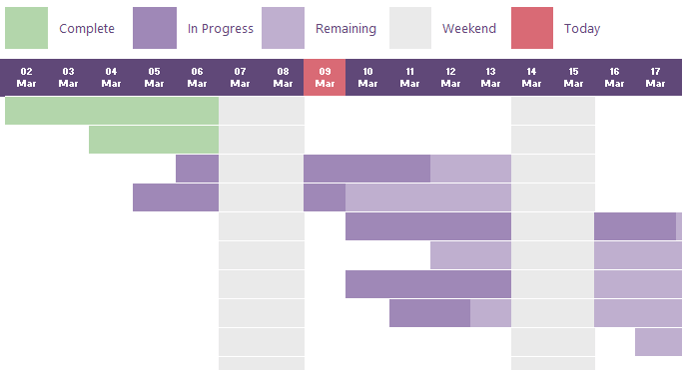
Tip: colour code the font for the different phases so it’s easy to see them grouped together.
Final Result
From a blank worksheet you now have a fully dynamic Gantt chart.
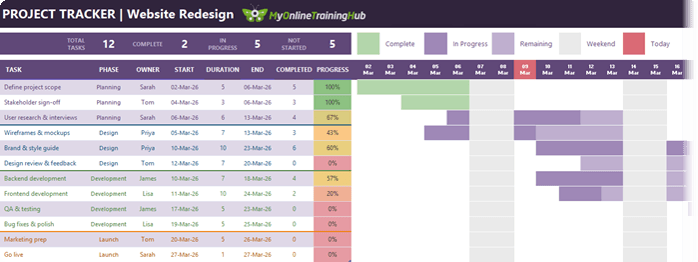
It automatically adjusts when:
• Start dates change
• Task durations change
• Work progress updates
Everything runs on formulas and conditional formatting.
No add ins.
No macros.
No project management software required.
Take Your Excel Skills Further
If you enjoyed building this Gantt chart, you are already using many of the techniques that separate everyday Excel users from advanced ones.
This project combines several powerful Excel skills including structured tables, dynamic formulas, conditional formatting, and automated calculations. When you put these tools together, you can build spreadsheets that update themselves instead of needing constant manual fixes.
These are exactly the types of skills I teach in my Excel Expert course.
Inside the course you will master how to combine formulas, tables, and automation techniques to build real tools for work such as project trackers, reporting models, and dynamic dashboards.
If you want to move beyond basic spreadsheets and start building solutions like this confidently, you can learn more about the Excel Expert course here.



Can this be converted to weeks instead of days?
Yes. If you get stuck, please post your question on our Excel forum where you can also upload a sample file and we can help you further.
never mind it was because I did not leave a gap and the formula was in a table header which generated 0. Doing outside of the table works. question does the date format extend automatically or do I have to do that manually?
Glad you figured it out, Mike. The dates will extend automatically.
step 5 givesme a list of numbers starting at 0