In this post I'm going to look at how you can create an Azure Machine Learning experiment to predict diamond prices. Then set up the experiment as a web service, connect Excel to it, and use it to estimate the prices of diamonds.
If I had to explain what machine learning meant, in this context, I'd say it's using algorithms to analyse data for features that will allow us to estimate a particular property of something given some new data.
Or in English, if my machine learning algorithm examines the weight, colour, clarity and dimensions of a large number of diamonds of known value, it can then estimate the value of another diamond if I can feed it that diamond's weight, colour, clarity and dimensions.
I'm assuming here that the weight of a diamond is a good marker for the price, but obviously there are other things that affect the price. But for the sake of simplicity for this example, I'm going to look at the relationship of weight vs price.
What Algorithm To Use for ML
There are many different algorithms that you can use for machine learning. You don't need to know the nitty-gritty of how the algorithm works though.
Of course a decent knowledge won't hurt you, but I don't need to know the details of how the linear regression algorithm works. I just know that I can use it to create a model of diamond prices if I feed it suitable data.
Linear Regression
Using a linear regression model means I need to have data that when plotted, forms a nice, straight line, and that what I am trying to estimate is a number.
I'm using the diamonds data set from Kaggle. If we look at a plot of the price of the diamonds against the weight we get this, which isn't exactly a straight line.
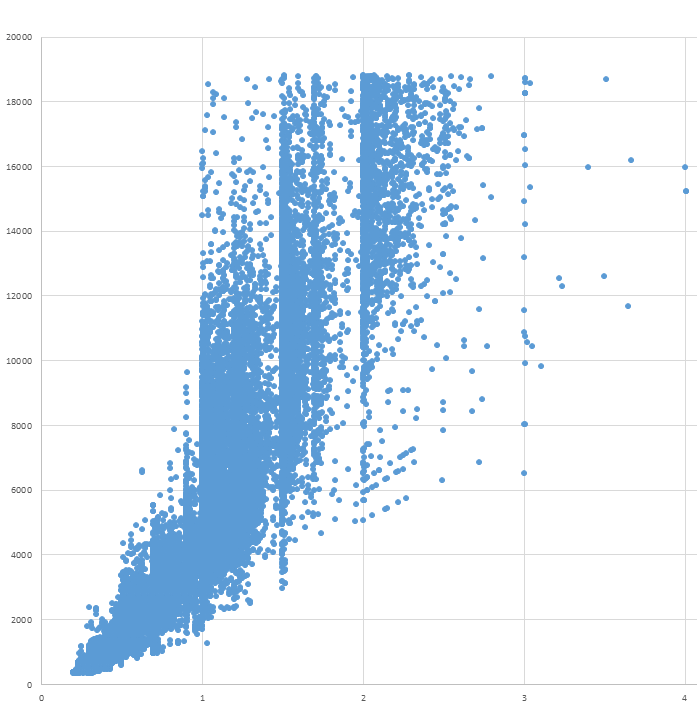
So I'm going to split the data into separate parts. I found through examining the data that internally flawless diamonds less than 0.82 carats, with color H, I or J, and with Very Good, Premium or Ideal cut, have a pretty good linear relationship for their weight v price.
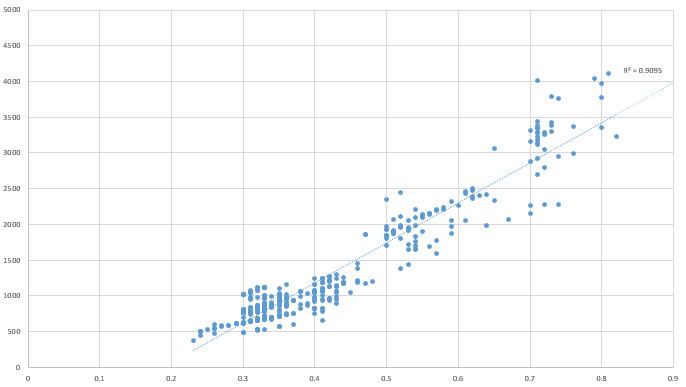
It may not be the best straight line plot in the world, but remember this is only for the purposes of learning how to use ML in Excel.
Creating the Machine Learning Experiment
Microsoft provides Azure ML Studio (AMLS) for you to create your machine learning experiments. You can get your hands dirty for free, and there are also paid subscriptions options available.
The language used in this arena is to refer to what we create in AMLS as an experiment. There are two parts to this, the training experiment, and the predictive experiment. For predictive experiment, think predictive model.
It's in the training experiment that we provide data for the algorithm to analyse, or learn, what attributes of a diamond may be important in predicting it's value. You can re-run this part of the experiment many times until you are happy that you have an accurate, or as accurate as you can get, model.
Once you are happy with your model you can turn this into a predictive experiment and make it available as a web service. Which basically means you can connect to it via Excel, a web browser, or programmatically using something like Python.
By giving the web service some data relating to a diamond it will return it's estimation of the price of that diamond.
Setting up the Experiment
Microsoft provide a pretty good guide for setting up your first ML experiment which you should read.
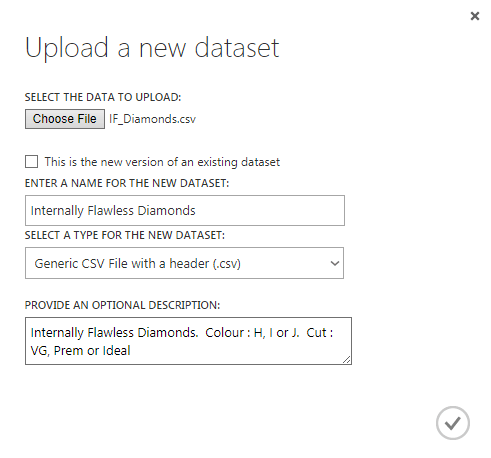
Once you've got yourself set up in AMLS, the first thing to do is import the internally flawless diamond dataset, which you can download at the bottom of this post.
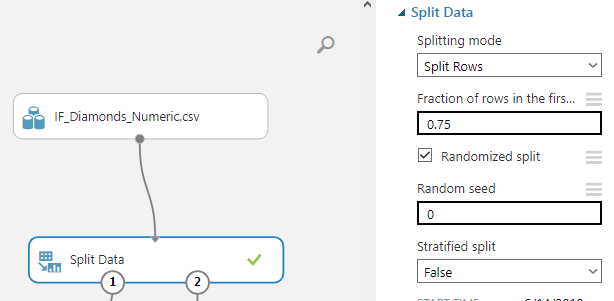
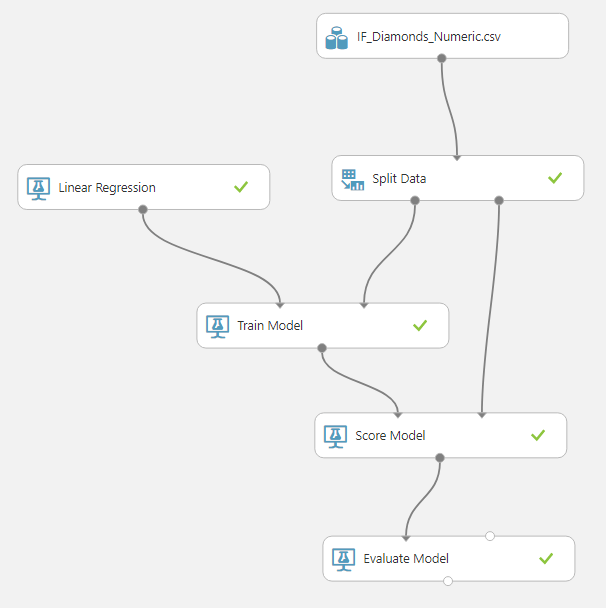
To teach, or train, our experiment we need to provide it with some sample data to analyze so we will use the Split Data module to split the data. We'll use 75% of the data to train the model and then use the remainder to evaluate how well our experiment estimates diamond prices.
We can now add the Linear Regression module and train the model.
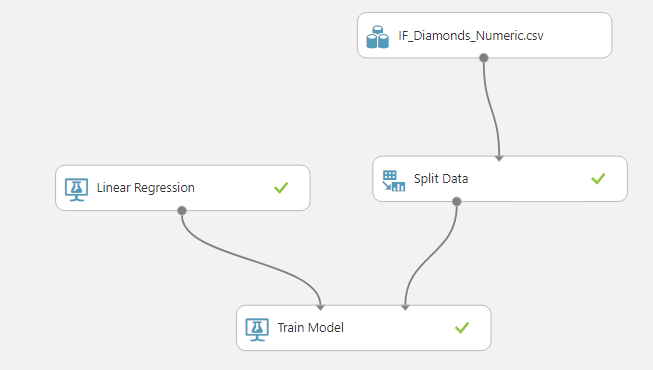
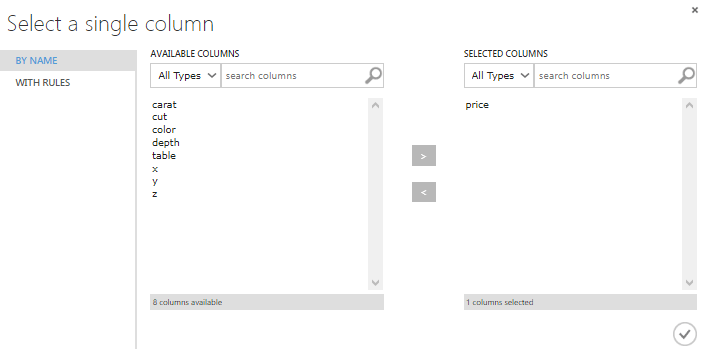
We need to tell the experiment what it is we want it to predict, so by clicking on the Train Model module, we can select the column in our dataset that we want the linear regression algorithm to predict.
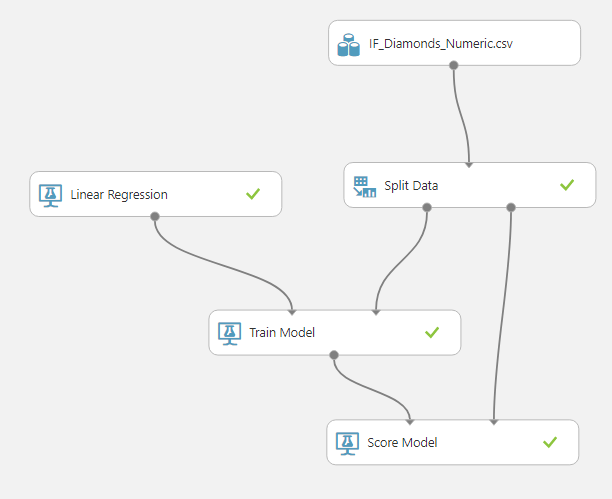
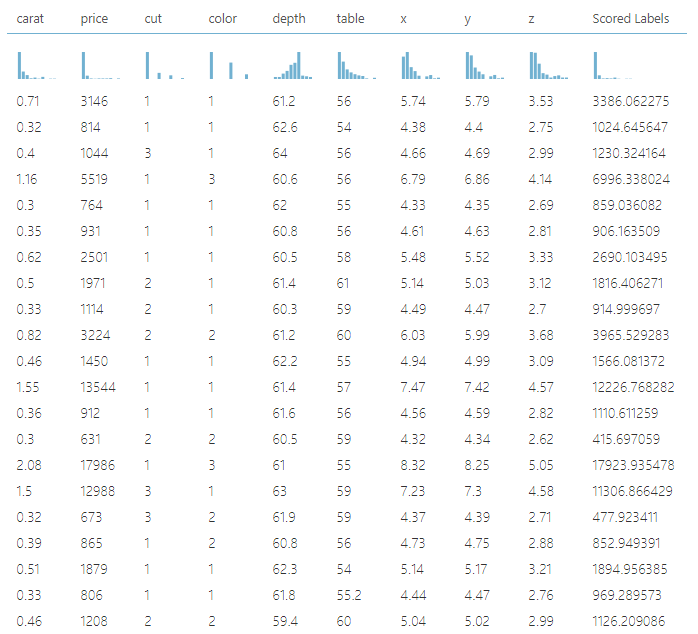
After training the model we connect a Score Model module which tries to predict the value of the 25% of the dataset we didn't use for training.
The results are provided like so
Finally we use an Evaluate Model module to see how well our experiment is at predicting the diamond prices
These results are provided as a series of metrics
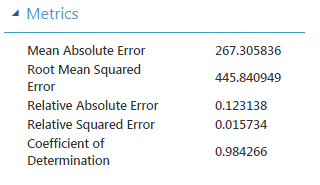
A measure of how good the model is at predicting prices is the coefficient of determination, also known as R2. You'll see that the model achieves slightly better than Excel does (0.9095) for the trend line in the plot shown earlier in the post. The closer R2 is to 1 the better, so I'm quite happy with this as a rough model.
Creating the Predictive Experiment and Web Service
After saving the training experiment you can then set it up as a web service.
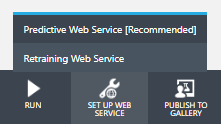
AMLS creates the service for you but you can modify certain aspects of how it works.
For example, I have added an Edit Metadata module to change the name of the output from the service from the bland 'Output' to 'Price'.
I have also added a Select Columns in Dataset module so that the service returns only the Price. By default it will return all the attributes of the diamond i.e. color, clarity etc even though we aren't interested in these.
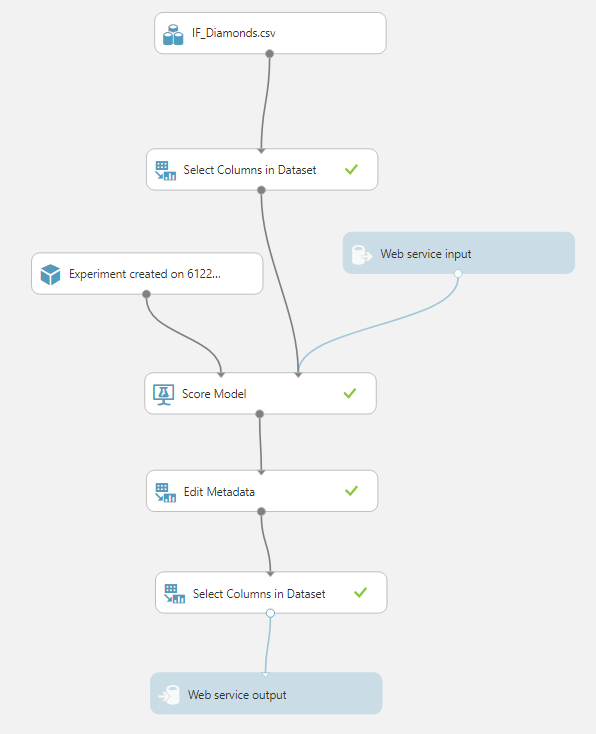
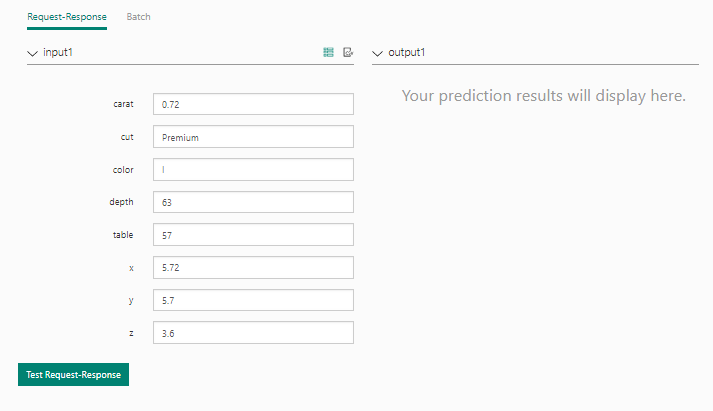
With all of this set up you can test your web service from within AMLS
Using the Web Service In Excel
Microsoft provide an AML add-in for Excel that allows you to use web services. You need to know URL and API key for the service to connect to it though.
An easier way is to download the workbook direct from AMLS when you look at your web services
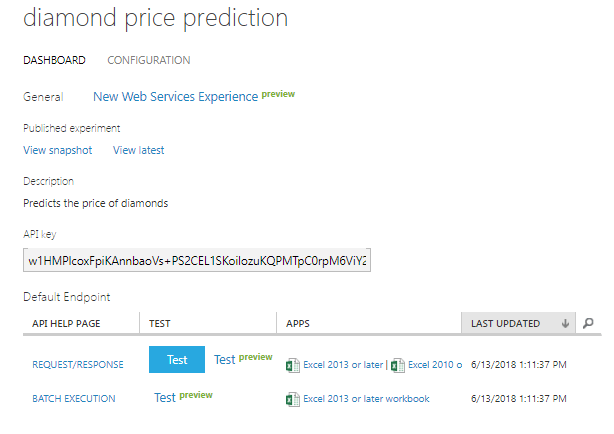
You can download the workbook appropriate to your version of Excel.
When you open it on the right hand side of your screen you'll see the AML app starting and then see the name of the web service 'Diamond Price Prediction'.
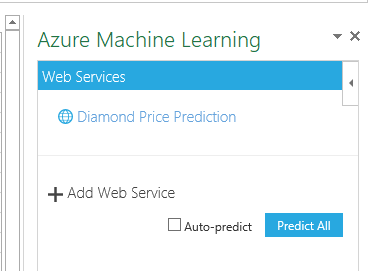
Click on the web service name and it will be started ready for you to use.
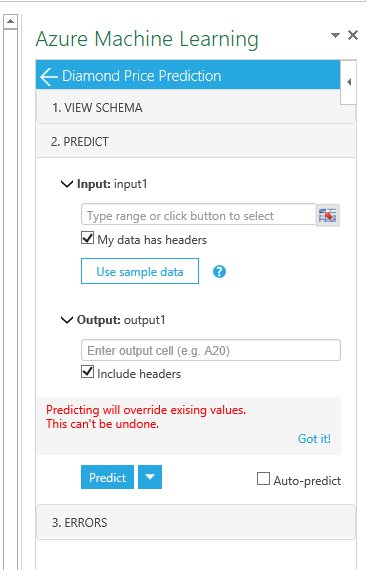
Use the range selection icon to use your mouse to select the input data, rather than manually typing the range. When you've done this the app just says 'Range selected' rather than actually telling you what range you have selected. Check the box if your data has headers, but there's no need to supply headers for this.
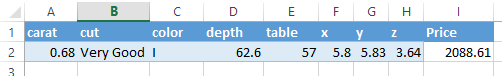
You can type the cell reference into the box for the output (the predicted price returned by the web service). Click the Predict button when you are ready and you should get a result for your diamond.
My input range is A2:H2 and the web service returns a value of 2088.61 in cell I2.
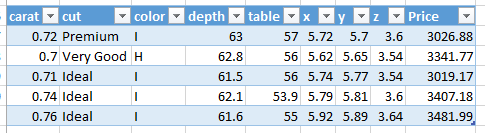
You can supply data for several diamonds at once and the web service will return its estimate of their values. If my data starts in A1 (including the header row) then I just need to specify a single cell as the output (I2) and the diamond prices will be inserted into the appropriate cells in column I.
Download the Workbook and Data Set
My workbook with the Azure ML app and the data set I used for the diamonds are provided for download. Enter your email address below to get these.


This post was the best ever!
Philip, do you think in post more about ML using Azure, merge it working with excel and database?
Hi Guilherme,
I’m not sure what you mean. In this post I’m using AML as a tool to help me predict the value for something. You can still use Excel for everything else you would in combination with this AML service connection.
Regards
Phil
Hi Phil, sorry if I didn´t make myself clear.
I mean is, will you show more examples using ML and excel?
Thanks a lot.
Hi Guilherme,
I have nothing immediately planned but yes I’m sure I will write some more.
regards
Phil
Dear Philip, This is very helpful. I would love to see a series on ML for advanced statistics users who are trying to learn these tools
Thanks Kamran,
I’ll consider this for future posts.
Regards
Phil
Good work
Thanks
Treacy, you must be a all-round genius. I admire you so much.
Hi Julian,
I’m not sure about that, but glad you liked the post.
Phil
Many thanks!!
Is this part of a webinar? Or is it a dead end?
Hi Alan,
There’s no webinar to go with this but that doesn’t make it a dead-end. This is intended as an intro to AML and if you follow it and the other links in the post, you should be able to set up your own experiments.
Regards
Phil