Ever felt like you're wrestling with spreadsheets, trying to make sense of overwhelming data, only to end up with static charts that barely scratch the surface of what's truly happening?
You're not alone.
In this Power BI tutorial for Excel users we'll turn that frustration into empowerment.
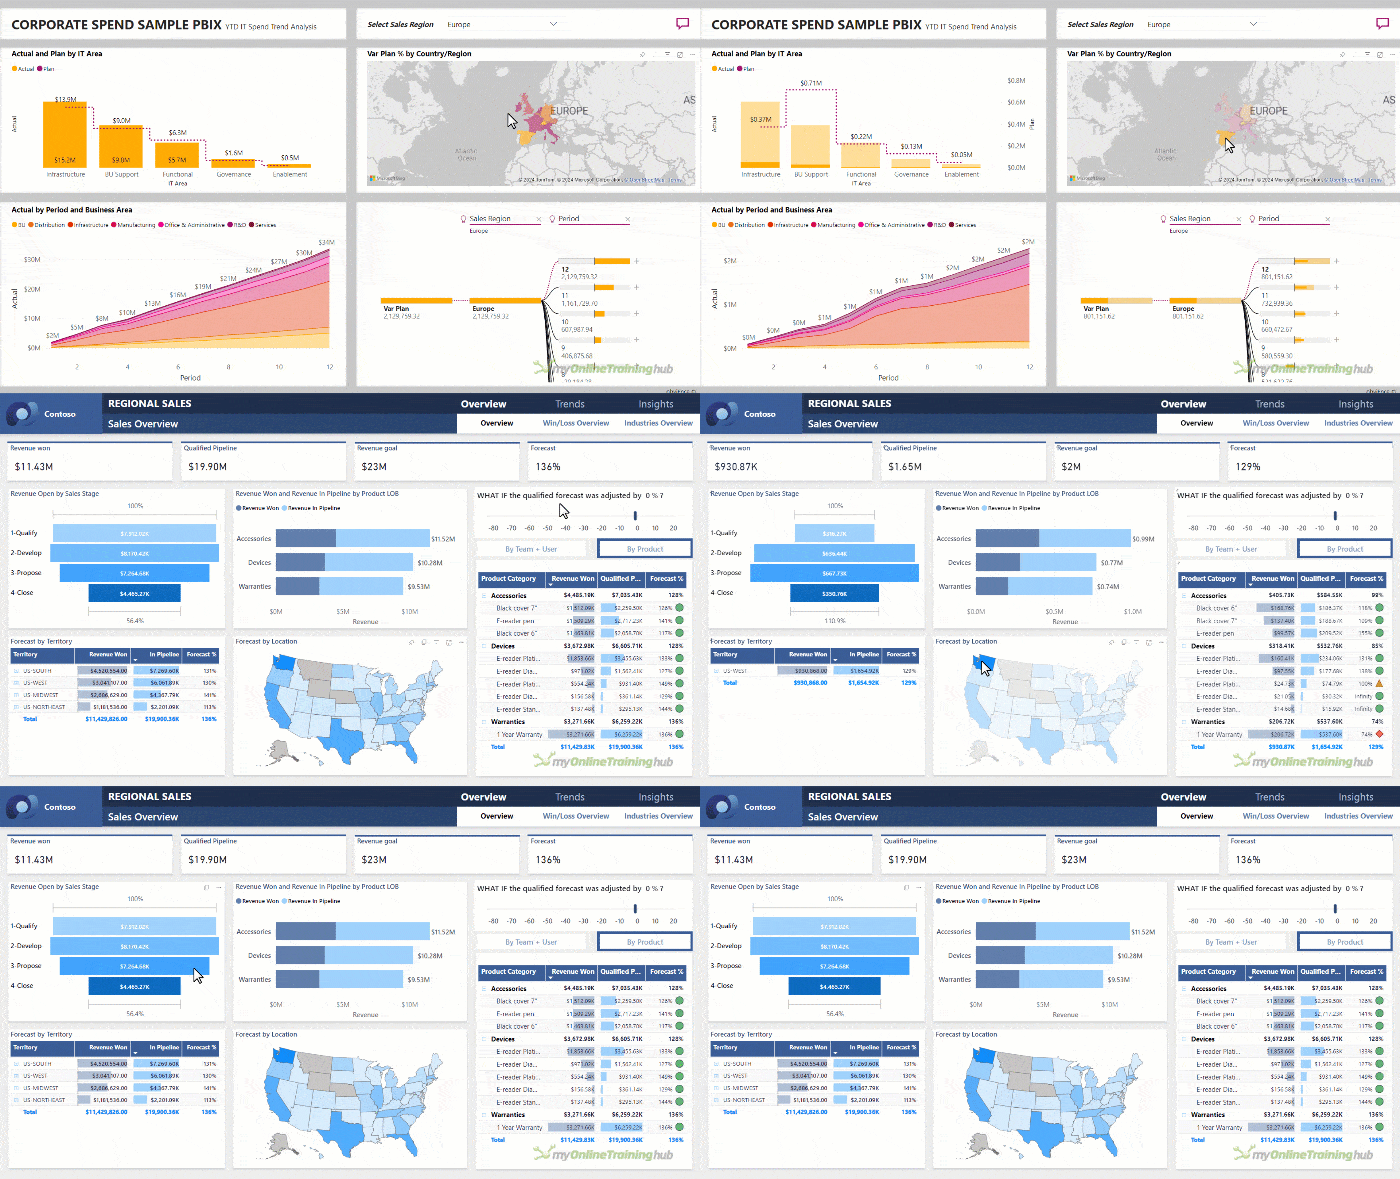
Power BI's visualization capabilities are not only more sophisticated but also interactive, allowing for insights that speak volumes more than static charts.
Table of Contents
Power BI's Myriad Data Sources
Power BI excels where Excel reaches its limits. With advanced data integration, it connects to almost any data source you can think of. Here are just a few!
Check out the video below to get up and running with Power BI:
Power BI Tutorial for Excel Users Step-by-step Video

Download Data & Power BI File
Enter your email address below to download the sample workbook.
Installing Power BI
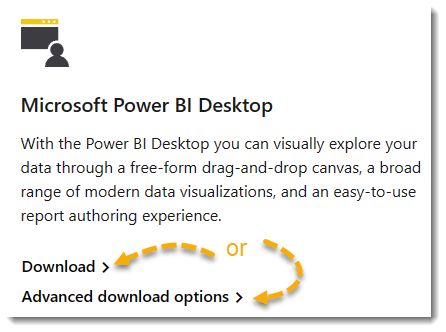
Head to the Microsoft Power BI website and under 'Microsoft Power BI Desktop', click on 'Download'. Or if you prefer, you can go to 'Advanced download options'.
Run the installer and follow the simple steps.
In no time, you'll be greeted by the Power BI interface, ready to start your data journey.
Loading Data
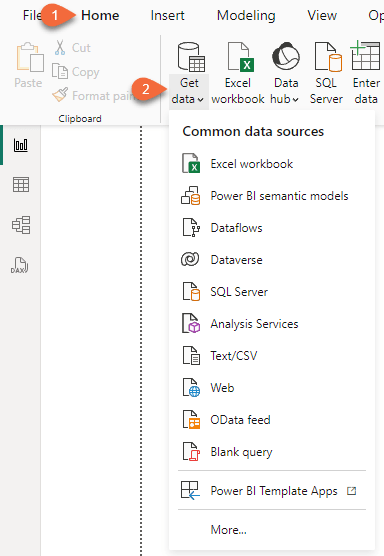
Open a new report and load your data:
Clean & Transform Data
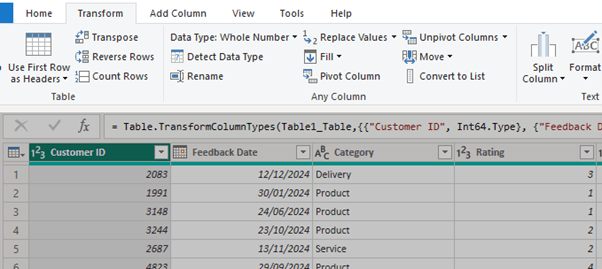
Use the same Power Query editor available in Excel to clean and transform your data - remove duplicates, filter columns, unpivot data to name a few. This step is crucial for ensuring your analysis is based on accurate and relevant data.
Cleaning your data in Power Query before starting your analysis is the key to saving time and avoiding headaches down the line. For our project today, I've already cleaned the dataset to keep things streamlined.
Model Data
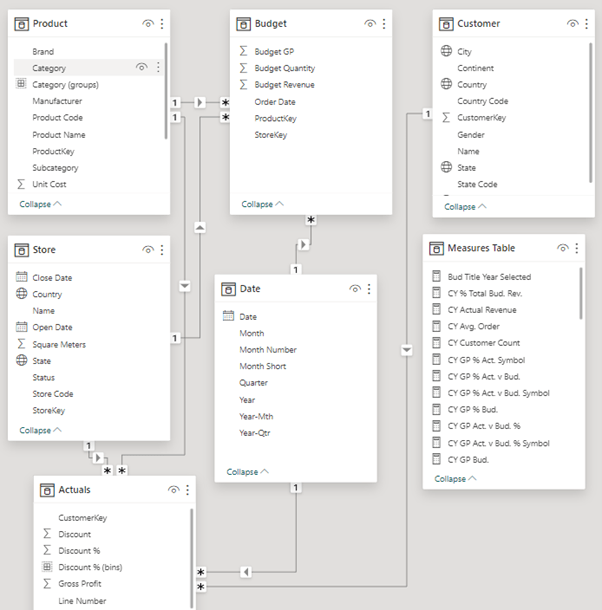
Power BI uses the same Power Pivot data model available in Excel, enabling you to create relationships between multiple tables:
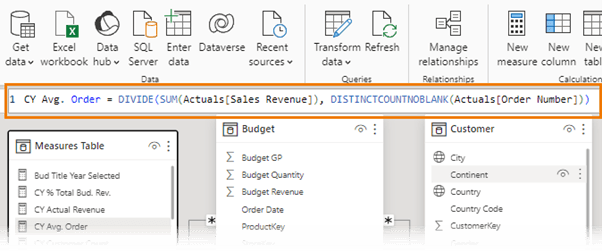
And write formulas to summarise and analyse your data with the DAX formula language (short for Data Analysis eXpression), which is very close Excel's formula style:
Data Visualization
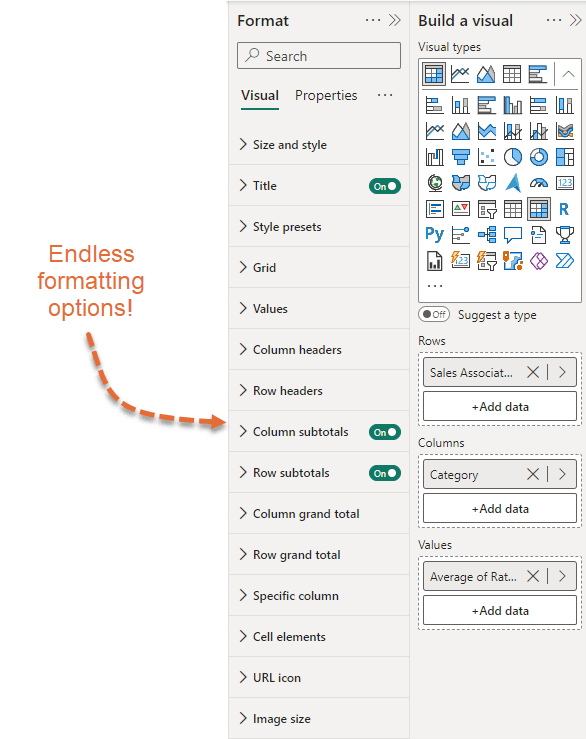
Power BI has a huge range of visuals to choose from and an extensive range of formatting options that far exceed what you can do in Excel.
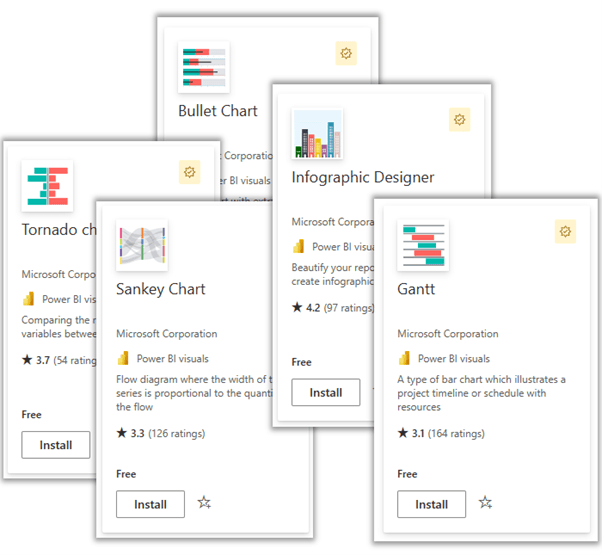
Plus, you can create your own custom visuals and access the library of custom visuals others have built:
Sharing Power BI Reports
Publishing your reports to the Power BI Service enables you to securely share your reports with people inside and outside your organisation. You can even restrict the data each recipient can see based on their role, allowing you to build one report for multiple users.
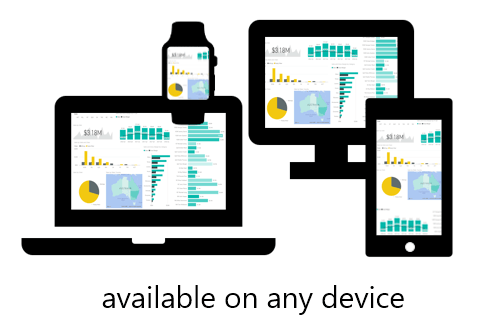
Power BI reports are available for your users on any device.
And one of the best things about Power BI is once you've built your report, you can schedule automatic updates, enabling you to never touch it again!
Next Steps
If you're excited to master with Power BI so you can wow your boss with dynamic, interactive reports that update themselves, check out my Power BI course.
You can also get my Power Query course and Power Pivot & DAX course in a discounted bundle if you don't already have these skills from working with them in Excel.



Thanks for yet another clear and concise tutorial, Mynda.
This one whetted my appetite, but when I tried to download the Power BI installation files I hit a fence: my Microsoft log-in was not accepted because it was not a school or business account. As a longtime retiree I have neither. Pity.
Thanks, Chris. You can get a suitable email address for Power BI with a free Microsoft 365 trial. The steps are explained here.
Mynda