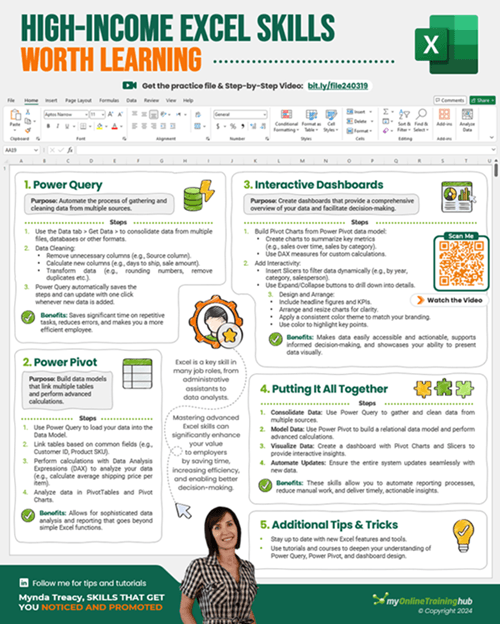
Believe it or not, more than half the job listings across a wide range of industries identify Excel as an essential skill. From administrative assistants to sales managers and data analysts to name a few.
I'm going to share 3 Excel skills employers want that will put you on the fast track to the top.
The turning point comes when you master Excel skills that can either make a company money or save a company money, or preferably both.
Table of Contents
Excel Skills Employers Want Video

Download Practice Files, Source Data & Cheat Sheet
Enter your email address below to download the sample workbook.
Download the Cheat Sheet
Example Data
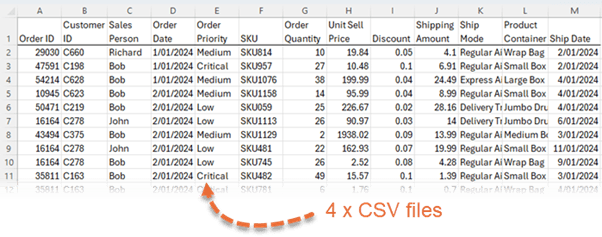
I've got 4 years' worth of sales order and shipping data stored in separate csv files that I'll use to demonstrate. Of course, these could just as easily be monthly data files that get exported from a system.
If we look at one of the files (see below) you can see it contains columns for the order information, product and pricing details and shipping data. Each file has a couple of thousand rows.
Excel Skills Employers Want - 1
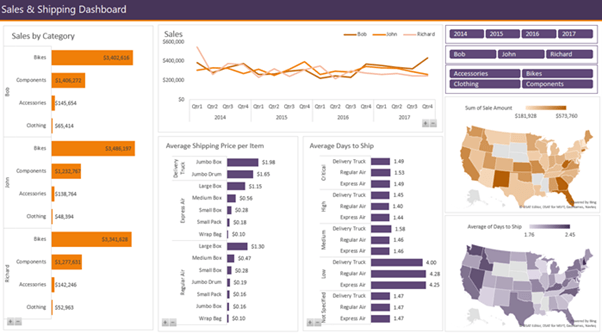
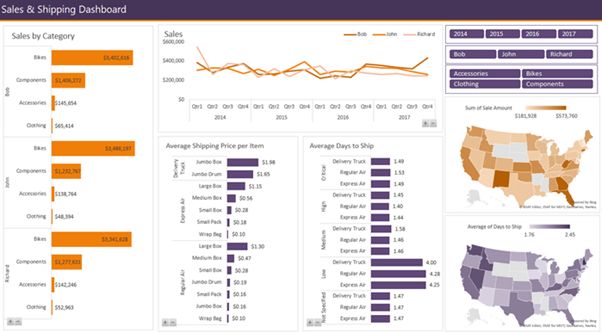
Let's say one of your tasks is to consolidate this data into a single table and then generate a Dashboard report like the one below (which I show you how to build in the video above), that enables management to make strategic business decisions at a glance. AND you need to be able to update this report with the click of a single button.
The first step is to automate the data gathering and cleaning process with Power Query.
This is going to save your company money and make you an invaluable employee and I don't mean you'll be more productive; I mean life changing efficiency gains.
Here's a comment left on one of my Power Query videos where Emmanuelle states they've been able to produce their work in half the time. Imagine being able to halve the time it takes to do your work.
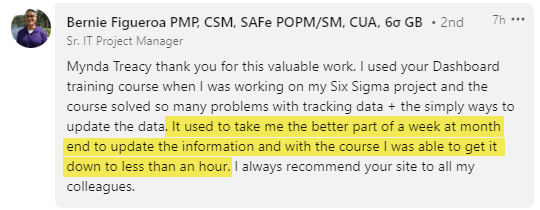
And here's another from Bernie who says his report used to take the better part of a week at month end and he was able to get it down to less than an hour.
I don't know what Bernie's hourly rate is, but let's be conservative and say it's $30 (it's probably way more seeing he's a Senior IT Project Manager) and it took 30 hours to create his reports each month, and now it takes less than an hour, that's over $10,000 in savings per year.
And while it might not sound like a lot, if your company's net profit margin is 10%, that's the equivalent of generating $100,000 in sales.
But probably more importantly, Bernie's report is now in management's hands a week earlier every month enabling them to make more timely decisions.
I don't think Bernie or Emmanuelle's companies are going to be letting them go anytime soon.
Power Query Data Sources
This example uses CSV files, but Power Query can get data from loads of different sources including Excel, web, PDFs, databases, SharePoint, OneDrive and many more.
Check out the video above to see Power Query in action and if you're ready to learn more, check out my comprehensive Power Query course which focusses on enhancing your efficiency, reducing your workload from days to minutes!
Excel Skills Employers Want - 2
Power Pivot enables you to create data models within Excel that connect multiple tables together into a relational database, similar to Access. From there you can summarise and analyse the data in PivotTables and Pivot Charts.
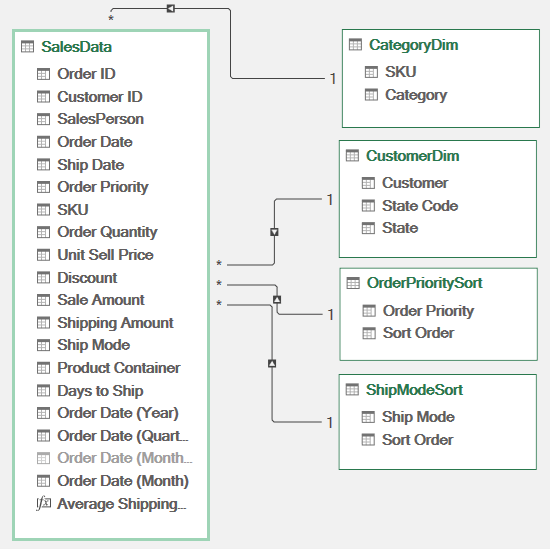
After loading your data with Power Query (as shown in the video above), start by creating relationships between the tables:
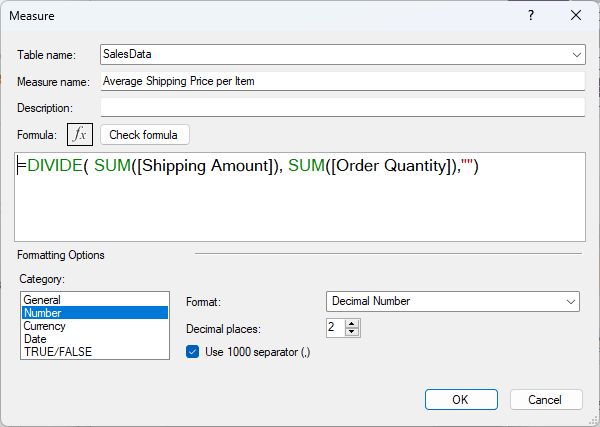
And with Power Pivot's formula language, DAX which is very close to Excel's (see example below), you can perform advanced calculations to analyse your data in ways you never thought possible.
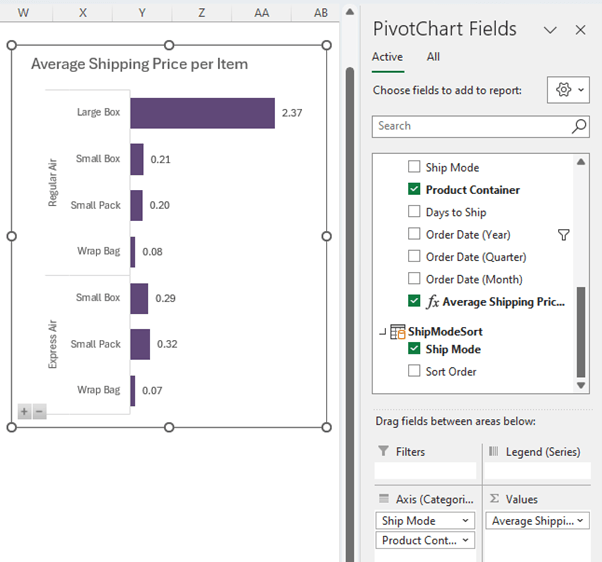
From Power Pivot you can go direct to PivotTable or Pivot Chart to analyse and summarise your data:
Power Pivot isn't limited by the number of cells in the Excel grid. It can handle 10s of millions of rows of data and beyond.
My Power Pivot & DAX course offers a comprehensive path. These tools help reveal insights that can guide your company towards new opportunities.
Taking these courses is about positioning yourself as a key strategist and analyst who can uncover and ask the pivotal questions that drive progress.
Excel Skills Employers Want - 3
We've arrived at perhaps the most visually impactful skill: data visualization with Excel dashboards. This skill is more than just presentation of data; it's about transforming data into a narrative that informs the decision-making processes effortlessly.
A well-crafted dashboard does more than display numbers; it narrates the story behind the data through charts and summary statistics. This narrative enables stakeholders to grasp complex insights at a glance. And this is where you can help the company make money by making data not just accessible but actionable.
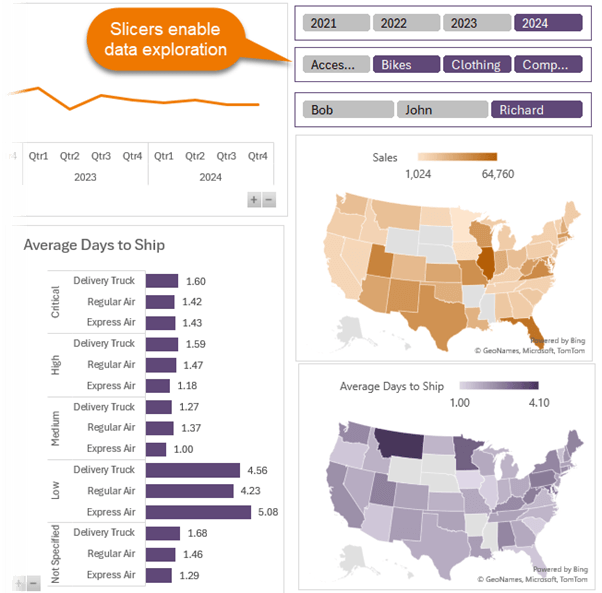
While many dashboards are adequate as is, with Excel we can enable data exploration with the use of Slicers to filter various segments of the data:
Updating Reports with One Click
It's one thing to set up a report like this, but you don't want it to be a burden each time you have to update it. Thankfully, when you get your data with Power Query and then model it with Power Pivot and build your analysis based on PivotTables and Pivot Charts, you can update them with one click of the Refresh All button on the Data tab of the ribbon:
Won't that make me redundant?
You might think that building reports like this will see you out of a job, because there's nothing to maintain. On the contrary, being able to build simple solutions like this that you can hand over to someone more junior, frees you up for promotion into other roles. The last thing you want is to be so essential to a role that your boss can't bear to let you move on.
Next Steps
Mastering Power Query, Power Pivot, and Excel Dashboards is not just about honing your data analysis skills; it's about securing your place in the ever-evolving job market and unlocking doors to unprecedented promotion opportunities.
By leveraging these powerful tools to streamline operations, uncover revenue-generating insights, and drive significant cost savings, you position yourself as an invaluable asset to any organisation.
Embrace these skills today and pave your way to a future where job security and career advancement are not just possibilities but certainties.
Tip: get all 3 courses in a discounted bundle from my Excel Dashboards course page.



Fruitful and great input
Thank you very much
Emad
Great to hear, Emad.
i need some help with a a bellcurve or population distribution spreadsheet. how can i reach out to you
You can post your question on our Excel forum where you can also upload a sample file and we can help you further.
Great .
Glad you found it useful.
Regards
Phil
Hi Mynda,
Thanks for another lesson! I am also 63 and still learn new things. I tell my students to continue their Excel training after graduation by watching your Youtube videos. I hope you don’t mind.
Steve
Great to hear, Steve. And thank you for encouraging your students to watch my videos. I hope they find them helpful.
Thank you for your help and “pass it forward” approach. I have used your videos for a lot of years now, I’m in my last 4 years before I retire, and I still use this information to better myself “Every day is a school day” even at 63YO. I am also linked to a consultancy group called Seraph, and they are now beginning to advise your website in the circular newsletters.
Again a big thank you.
That’s awesome to hear, Steve! Thanks for spreading the word about us.
Keep on Excel-ling 😉