Hi everyone
With the rise in the price of steel in construction, it means a lot of clients are keen to see how their projects are being affected by this.
I would like to group totals under Headings, and then subtract these. Unfortunately I cannot see how to do this in a Pivot.
Has anyone got any ideas on how this can be achieved?
Thank you
Tom
Hi Tom,
Power Pivot can do this. Demonstrated it in your file which I re-attached below.
Riny
Hi Riny,
Thank you for this. This definitely works and answers my question. I am interested to carry out some other transformations inside Power Query, is there a way to perform this operation in PQ only?
Thank you
Tom
I guess you could do this is in PQ by grouping, merging and subtracting.
Maybe I overcomplicated the issue, but is this what you're looking for?
Hi Jessica, thank you for this. I believe this is also using Power Pivot like Riny's solution. Your solution works great albeit the AA29 doesn't equal V29 but this is because of the interesting approach you have used (max of running difference).
No, I used Power Query, but I did have to load the queries to the data model, but that is all I did with the data model. If you open PQ you will see the tables I used; I created a running total column, grouped your original project costs together and merged that with the revised cost table then subtracted the running total column from the original total column to get the running difference and used the max to create the pivot table as that is the difference of the total revised and total original costs. As I said, the only thing I did was load the tables to the data model. I hope I'm making sense. You should be able to follow my steps in PQ, let me know if you have any questions.
Hi Tom,
Since you specifically asked for a PQ only version, I've added such to the file. As mentioned in my response (#4 above), it's a simple Grouping of both tables, Merge them, Expand and Subtract.
Riny
Thank you Riny and Jessica for looking into this and apologies for the delay - I have been travelling to see my family overseas. I also had a bit of a think about what I was really wanting to achieve with my original query and have added a revised attachment.
What I was after was a Pivot that behaves a bit more flexibly when showing a differences column to allow deeper interrogation of cost differences.
Could you please let me know if a Pivot can behave like Desired_result_Pivot_1 and Desired_result_Pivot_2? You will notice that Allowance for furring channels is not captured in the Original_cost_estimate for example.
Have a look at the attached file. Both Pivot tables can basically be the same. On one you collapse the Heading field. On the other you Expand the Heading field.
And to include any new lines from the Revised table, it's easiest to merge the Revised table (i.e. as the top table) with the Original (i.e. as the bottom table), LeftOuter.
Thank you for this Riny. This works very well when Original_cost_estimate and Revised_cost_estimate are the same, but not if there is a unique item in Original_cost_estimate. Could you please amend this to capture unique items from the Original_cost_estimate table?
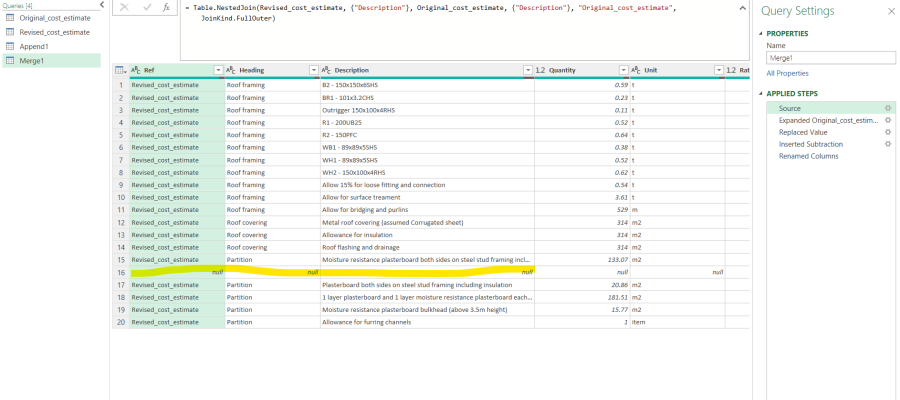
Not able to spend time on this now, but try a FullOuter join. Come back if that doesn't work. Otherwise, I'll have a closer look tomorrow, my time (i.e. CET).
Hi Riny,
This won't work per the screen shot. This makes sense because the item Contingency for rotting rafters does not appear in Revised_cost_estimate so I don't think amending the join type will make a difference.
Thank you

Good morning Tom,
Okay, I see. Then you do two merges. First Original with Revised, Then Revised with Original. Append the two, remove duplicate descriptions, replace any null value in either of the cost columns with zero. Add a column for the difference and you are ready to go. See attached.
Although, this works, I feel it should be possible to this more intelligently. Though, I can't see it right now.
Riny
Hi Riny,
Thank you for this. This works very well, however, sum of the Pivoting functionality is lost when duplicates are removed. I'd like to have the ability to have duplicate descriptions in Original_cost_estimate and Revised_cost_estimate per the attached. Is this possible?
Tom
