Hi,
I've been given the task of trying to figure out how a retired employee calculated future data. I've gone back and tried to replicate his past figures, but my numbers are not even close to the former employee's results.
The data has been collected from a 3 step mail survey. The first mailing is sent out and responses collected, which are named RM1 (return mailing 1). Non-deliverable mailings are labeled ND1. The 2nd mailing is sent out after removing the address which returned the survey or were non-deliverable. Again, the 2nd mailing is collected, responses labeled RM2 & ND2. The 3rd mailing follows the same pattern as the previous two mailings.
The original mailing list was composed of 8000 addresses. The returns are as follows: RM1=1138, RM2=549, RM3=280 (RM total: , ND1=91, ND2=78, and ND3=69. ND surveys are subtracted from the 8000 original addresses list totaling 7762.
Taking an example from this survey, Deer (bow hunters) RM1=307, RM2=105, and RM3=66, total: 478.
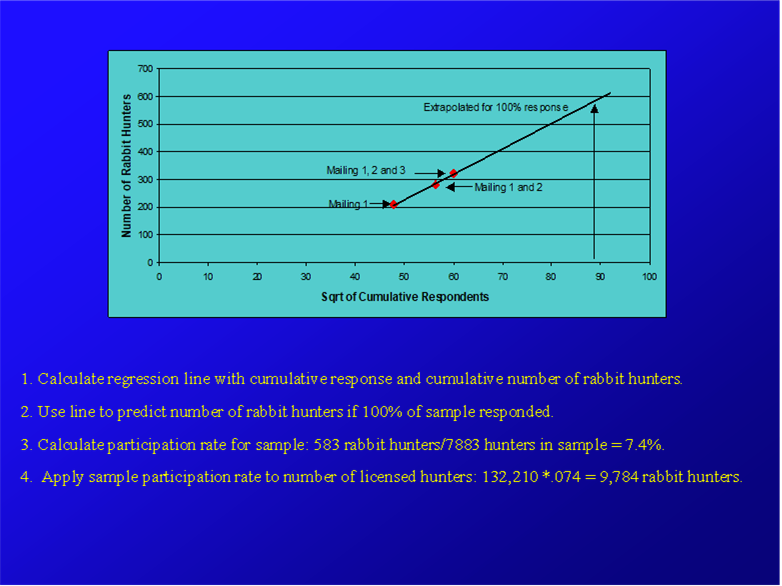
I would like to see what the number would be if every survey was returned in the deer example above. I remember doing something like this decades ago while I was in school. If I remember correctly, I used a regression line based on the cumulative responses and the cumulative number of deer hunters (bow). The line was used to predict the number of deer hunters if 100% of the sample responded. I then calculated the participation rate for the sample: #of deer hunters / 7762 hunters in the sample =X%. I then applied the sample participation rate to the number of licensed hunters: 132,210 * .X = XXXX deer hunters. Note: I seem to remember using the Sqrt of cumulative respondents vs Number of deer hunters to create a regression line.
My question is. How do I recreate these steps on Excel to produce a table and chart? I feel foolish for not remembering how to do this, but it's been 30 years since I was in school. I found something in an old paper with graph which I'm trying to replicate. Maybe this helps?
Thanks,
Brent
