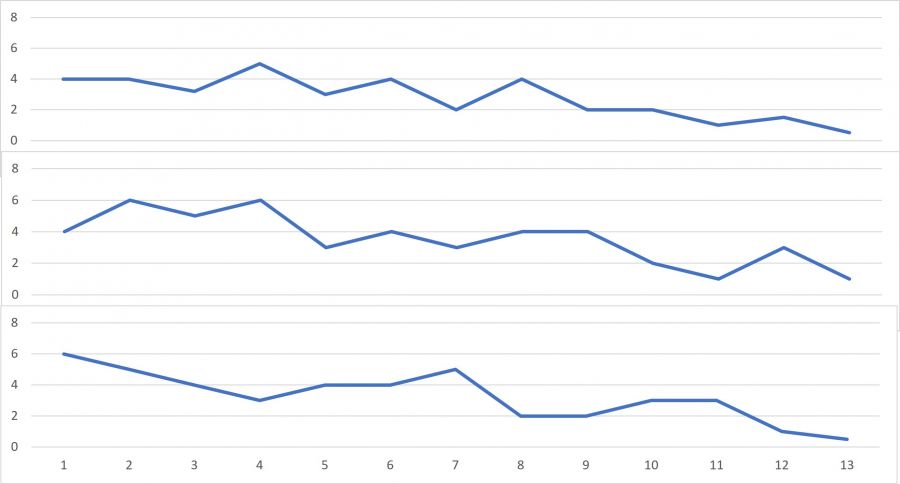
I am having difficulties trying to create a linear stacked chat for my data set, I have a couple of species growth recorded across 30years. I would want to post have them all on the same graph but showing each separately.
The image attached is actually 3 separate charts. You cannot have one chart with the vertical axis restarting at zero part way up. If you want them in the one chart, then that is simply a line chart with 3 series and should be easy to create.
If you're having trouble, please provide an Excel file with your data so we can help you further.
Mynda
Hie Mynda,
Find attached my data set.
Hi Ndalowa,
Please see the file attached. Note: you may want to consider fixing the vertical axis so they're all the same using a ghost series.
Mynda
Hie Mynda,
Thank you so much! checking out ghost series right away.
Ndalowa
