Sorry, Its hard to explain the problem properly in a few word for the title also I have a couple problems but I will start with the main one.
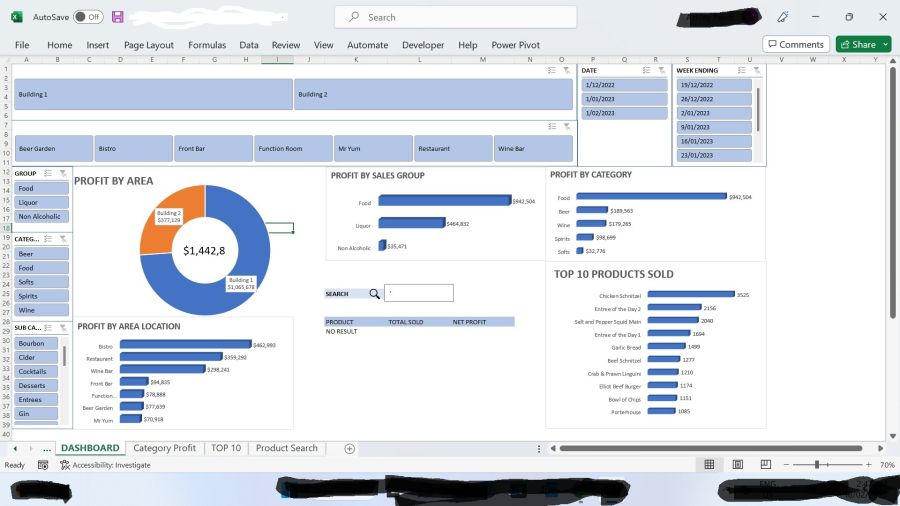
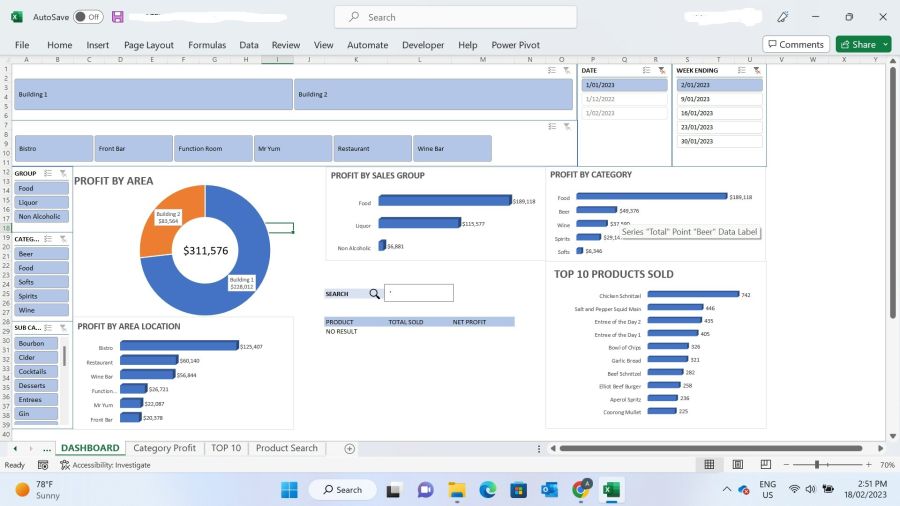
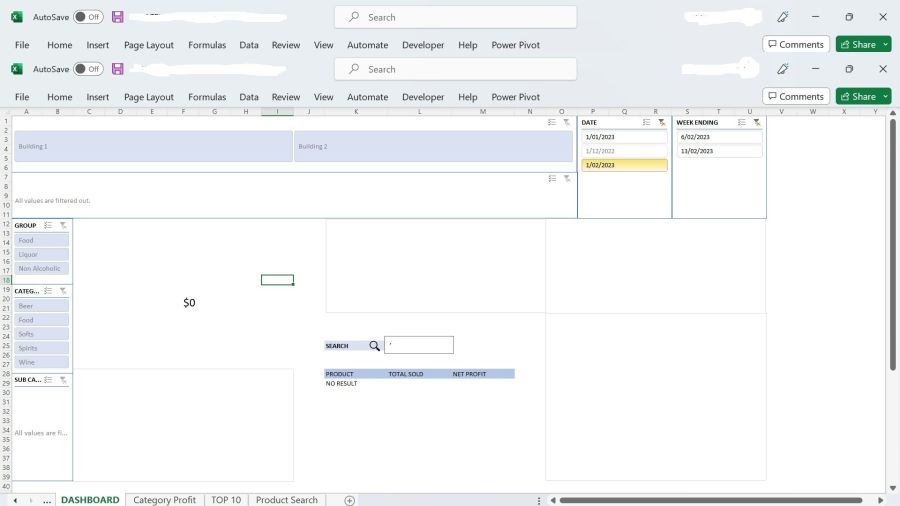
Ive got a dashboard showing sales and profit over the different categories and different locations and all seems to filter properly until I go to change months or locations where there is no matching data and the slicer doesnt know what to do and shows nothing and all my charts go blank. If you look at the pics, Dashboard1, everything is unfiltered and showing as it should. In Dashboard 2 Ive chosen January 2023 and weekending 2/1/2023 and everything has filtered as it should. In Dashboard 3 I choose February 2023 and the weekending slicer doesnt know what to show, finds no data and all my charts go blank until I choose a week in February and it comes good. The same thing happens when filtering the Categories and Sub Categories, if I choose beer item then go back to food it doesnt find what its looking for and my TOP 10 chart goes blank. What I need is for the slicers to have a default state where if I choose January it shows all the weeks in January, If I choose Beer it shows all the beer sub categories and if it cant do this what is your best suggestion around this.
Ok problem 2 and this relates back to the first 1 I had a year slicer and a month slicer to start with and I was having the above problem and watched a video of yours showing a slicer combining the year and month and thought that might help, it didnt, but I set it up in my data as "2023/01" but when its come into the slicer it show the day as well "01/01/2023". I tried changing it in the data model to I format I liked but it never passed through to the slicer, any ideas.
Problem 3 This dashboard is for a person of limited computer skills but I think he can handle it but there is alot of slicers to filter and was wondering if it is possible to make a clear filter button on the dashboard to make it easy to clear the slate. I know people will say you can use this shortcut or you just go into the ribbon and push this but I want this to look clean without the ribbon and be as simple as possible. Also any design suggestions you may have to the layout would be helpful as I just find it very cluttered and a bit overwhelming, Ive focused on getting it working more than design at this stage.
Any help with any of these would be wonderful hope I havent asked for too much and the first problem is the main one I need help with
Sorry I forgot to add the pictures


Also not sure If my workbook uploaded as it gave an error so here it is with a couple sheets of data
Also Microsoft 365
Hi Ashley,
The behaviour described in issues 1 and 2 is not something you can change. The best you can do is educate the user. You could use the technique I use to force people to select a single item in the slicer, as explained here: Force Excel Slicers to Single Select
This puts a notice in the chart title alerting them to the issue and how to resolve it. I'm sure once they use the report a couple of times they'll realise what to do.
As for clearing filters, you would need to record a macro that does this and assign it to a button.
I hope that points you in the right direction. If you get stuck with the macro, please post a question in our VBA forum.
Mynda
